14 Nov 2025
|29 min
Qualitative vs quantitative research
In this article, we explore the difference between qualitative vs quantitative research, when to use each method, and how to analyze data effectively.

When it comes to user research, two key approaches stand out – qualitative research and quantitative research. But what sets them apart, and how do you know which one to use?
Both methods play a critical role in understanding your users, and often, the most effective strategies combine them.
In this guide, you’ll explore their key differences, the types of research involved, pros and cons, and how to strike the right balance to gain a complete view of your users.
Get the full research picture
Ready to combine qualitative findings with quantitative data? Try Lyssna for free and start gathering the complete user feedback you need to make informed decisions.
Qualitative vs quantitative research: What are the differences?
When you’re choosing between qualitative and quantitative research, the biggest difference is what you’re trying to learn.
If you want to explore why people behave a certain way or get a deeper understanding of their thoughts, qualitative research is your go-to. For more comprehensive user experience insights, combining both qualitative and quantitative methods can help you uncover deeper patterns and trends. It’s like having a heart-to-heart conversation with your users. You’re digging into their emotions, motivations, and unique perspectives.
On the other hand, quantitative research focuses on what people are doing by measuring that behavior in numerical terms. It involves gathering data and usability metrics that can be quantified, tracked, and analyzed. Think surveys, charts, and percentages that help you identify trends and patterns. If you want to know how many people clicked a button or what percentage of users dropped off at checkout, quantitative research is the answer.
Key differences at a glance
Factor | Qualitative research | Quantitative research |
|---|---|---|
Purpose | Understand the “why” | Measure the “what” |
Data type | Words, ideas, opinions | Numbers, percentages, and statistics |
Method | Interviews, focus groups, case studies | Surveys, experiments, usability testing |
Sample size | Small, targeted sample | Large, statistically significant sample |
Outcome | Insights, themes, motivations | Measurable data, trends, and benchmarks |
What is qualitative research?
Qualitative research uncovers the underlying motivations, reasons, and contexts that drive quantitative movements. For example, quantitative research may indicate a certain feature of your app is underused, but qualitative research will uncover why. It results in non-numerical data – often quotes from users – gained through in-depth analysis.
Utilizing open-ended tools like interviews, observations, comments fields, and user diaries, qualitative research can be highly subjective, reflecting not just the opinions and beliefs of users but the interpretations of researchers themselves.
Embracing this subjectivity is the key to understanding qualitative research. Its primary utility is its ability to reflect real-world conditions and impressions of your product or service, where all the careful internal design work comes into play with real users and use cases. Because the research tends to be more in-depth, it can be centered around a few users – Nielsen Norman Group recommends testing just five users.
Types of qualitative research
While quantitative research deals with numbers, qualitative research focuses on words, feelings, and deeper meanings. It’s about understanding the "why" behind user behavior, giving you rich, detailed insights. There are several methods you can use to gather this type of information, and each one works best in specific situations.
Interviews
Interviews are one-on-one conversations where you ask users open-ended questions and listen carefully to their responses. While surveys can include open-ended questions, interviews encourage deeper, free-flowing discussions, allowing users to expand on their thoughts and provide more nuanced feedback.
When to use interviews:
To understand the motivations, pain points, and emotions behind user actions.
To explore how users perceive your brand, product, or experience.
Example scenario: You’re redesigning your onboarding process and want to know where users get stuck. By interviewing 10 users, you learn that most struggled to understand a certain form field. Those findings help you rephrase the instructions and reduce confusion.

Focus groups
A focus group brings together users to discuss a product, idea, or experience. It’s like hosting a roundtable where participants bounce ideas off each other – and that interaction often sparks fresh insights.
When to use focus groups:
To generate new ideas for products, features, or messaging.
To test early concepts, prototypes, or marketing materials.
Example scenario: You’re working on a new home page design and want to know which version resonates most with users. You present three concepts to a focus group. As they discuss the layouts, you hear that people prefer the design with clearer calls-to-action. This feedback guides your final design choice.
Ethnographic studies
Despite the academic name, an ethnographic study is really just a fancy way of describing observations in a user’s natural environment. If you’ve designed a home-cooking app, for example, this may be watching a user work in their own kitchen.
Case studies
Case studies zero in on a particular incident to explore in great depth. If you’re designing healthcare software, this may mean doing a full exploration of how a given provider came to find your product, how they use it in their practice, which internal metrics and processes your software impacted, and what their outstanding needs may be. In this context, leveraging medical ux design principles can significantly enhance usability and patient engagement.
Examples of qualitative research questions
Examples of qualitative research questions are all about digging deeper. They’re open-ended, designed to help you uncover why users think, feel, or behave the way they do. These questions give you the stories, emotions, and insights that numbers alone can’t provide.
To make the most of qualitative research, it’s important to match your questions to your goals. Here are some examples, along with guidance on when (and why) to use them.
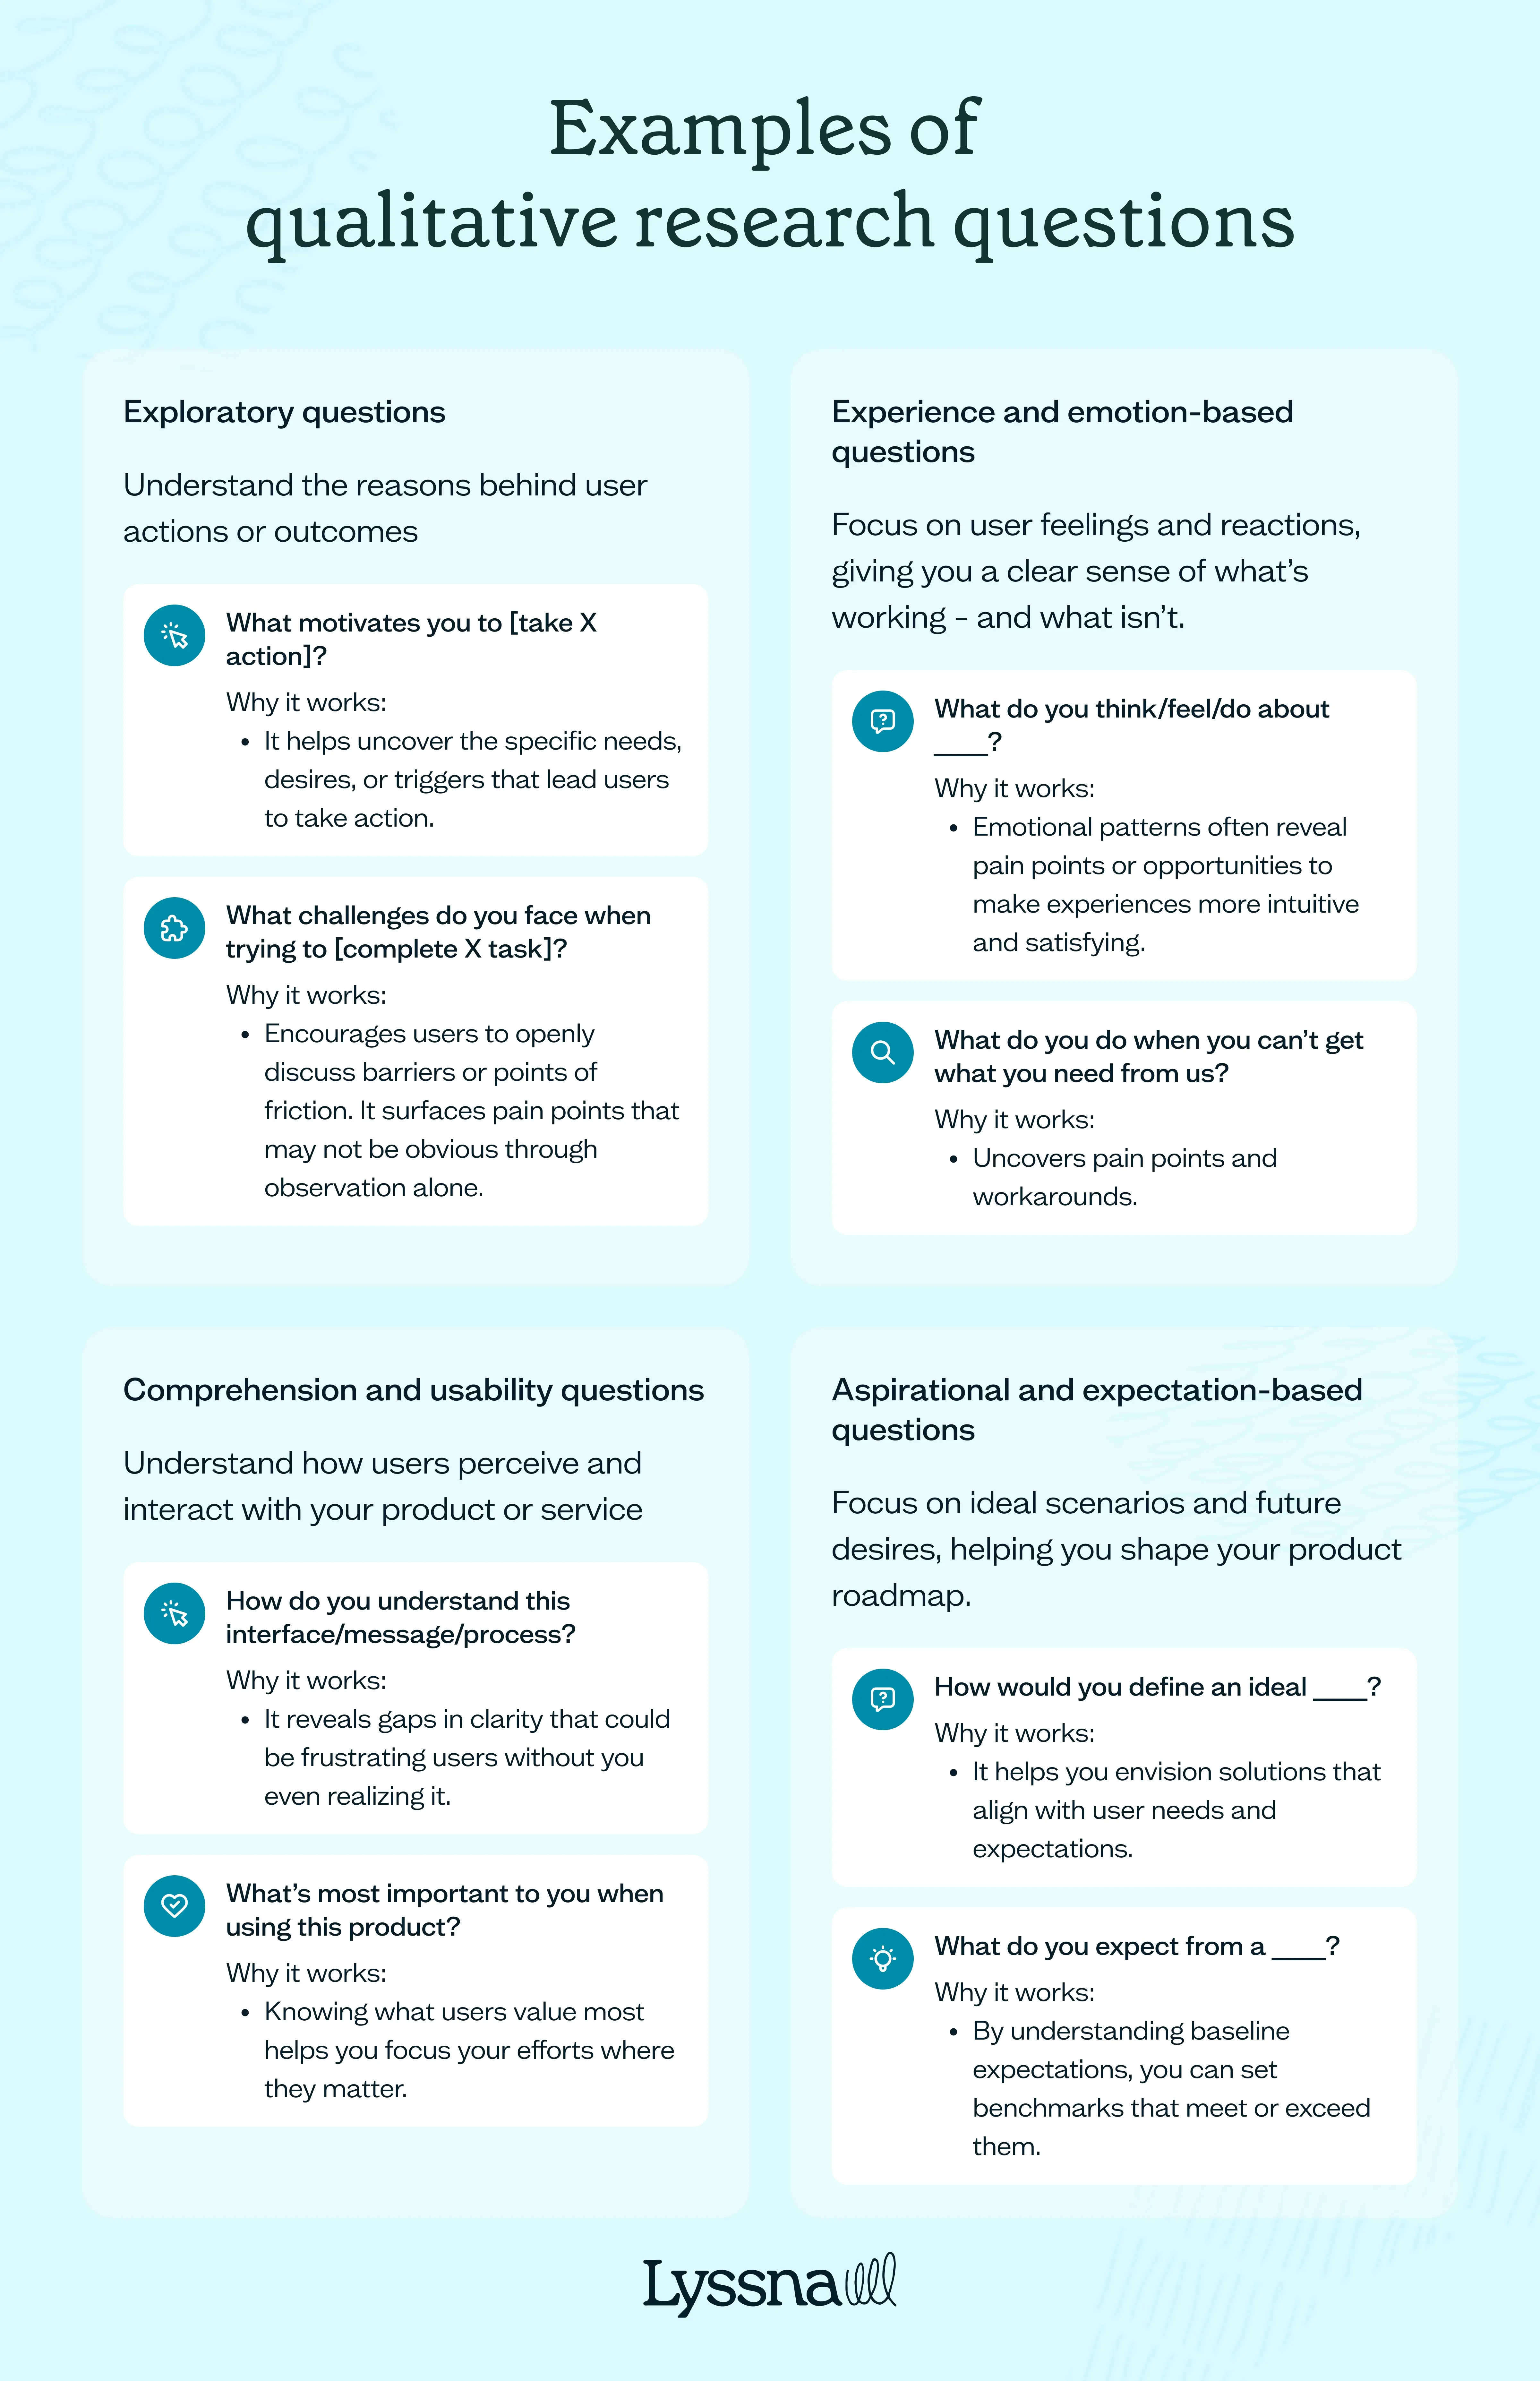
Exploratory questions
These questions help you understand the reasons behind user actions or outcomes, making them perfect for uncovering root causes.
What motivates you to [take X action]?
Example: “What motivates you to upgrade to a paid plan instead of staying on the free version?”
Why it works: This question reveals the underlying factors that drive user decisions. It helps you uncover the specific needs, desires, or triggers that lead users to take action. Knowing this can help you prioritize features, refine messaging, or create incentives that drive more upgrades.
What challenges do you face when trying to [complete X task]?
Example: “What challenges do you face when trying to schedule a meeting using our platform?”
Why it works: This question encourages users to openly discuss barriers or points of friction. It surfaces pain points that may not be obvious through observation alone. If multiple users mention the same challenge, it highlights a priority area for improvement.
Experience and emotion-based questions
These questions focus on user feelings and reactions, giving you a clear sense of what’s working – and what isn’t.
What do you think/feel/do about ____?
Example: “What do you feel when you try to complete this task?”
Why it works: Emotional patterns often reveal pain points or opportunities to make experiences more intuitive and satisfying.
Describe a positive experience with (the product, a process, a service).
Example: “Can you tell me about a time when using our product worked well for you?”
Why it works: Highlighting what users appreciate can help you replicate those successes in other areas.
What do you do when you can’t get what you need from us?
Example: “If a feature doesn’t work as expected, what’s your next step?”
Why it works: This uncovers pain points and workarounds, showing where to step in with better support or design.
Comprehension and usability questions
These questions test how users perceive and interact with your product or service, helping you identify areas of confusion.
How do you understand this interface/message/process?
Example: “What does this label mean to you?”
Why it works: It reveals gaps in clarity that could be frustrating users without you even realizing it.
What’s most important to you when using this product?
Example: “What’s the one feature you’d prioritize over everything else?”
Why it works: Knowing what users value most helps you focus your efforts where they matter.
Aspirational and expectation-based questions
These forward-looking questions focus on ideal scenarios and future desires, helping you shape your product roadmap planning.
How would you define an ideal ____?
Example: “What would the perfect checkout experience look like for you?”
Why it works: It helps you envision solutions that align with user needs and expectations.
What do you expect from a ____?
Example: “What do you expect from a customer support chat feature?”
Why it works: By understanding baseline expectations, you can set benchmarks that meet or exceed them.
Pros and cons of qualitative research
Qualitative research offers rich, in-depth insights you can’t get from numbers alone. It’s about understanding human behavior on a deeper level — why people think, feel, and act the way they do.
But, like any method, it has its strengths and limitations. Knowing when and how to use qualitative research will help you make the most of it.
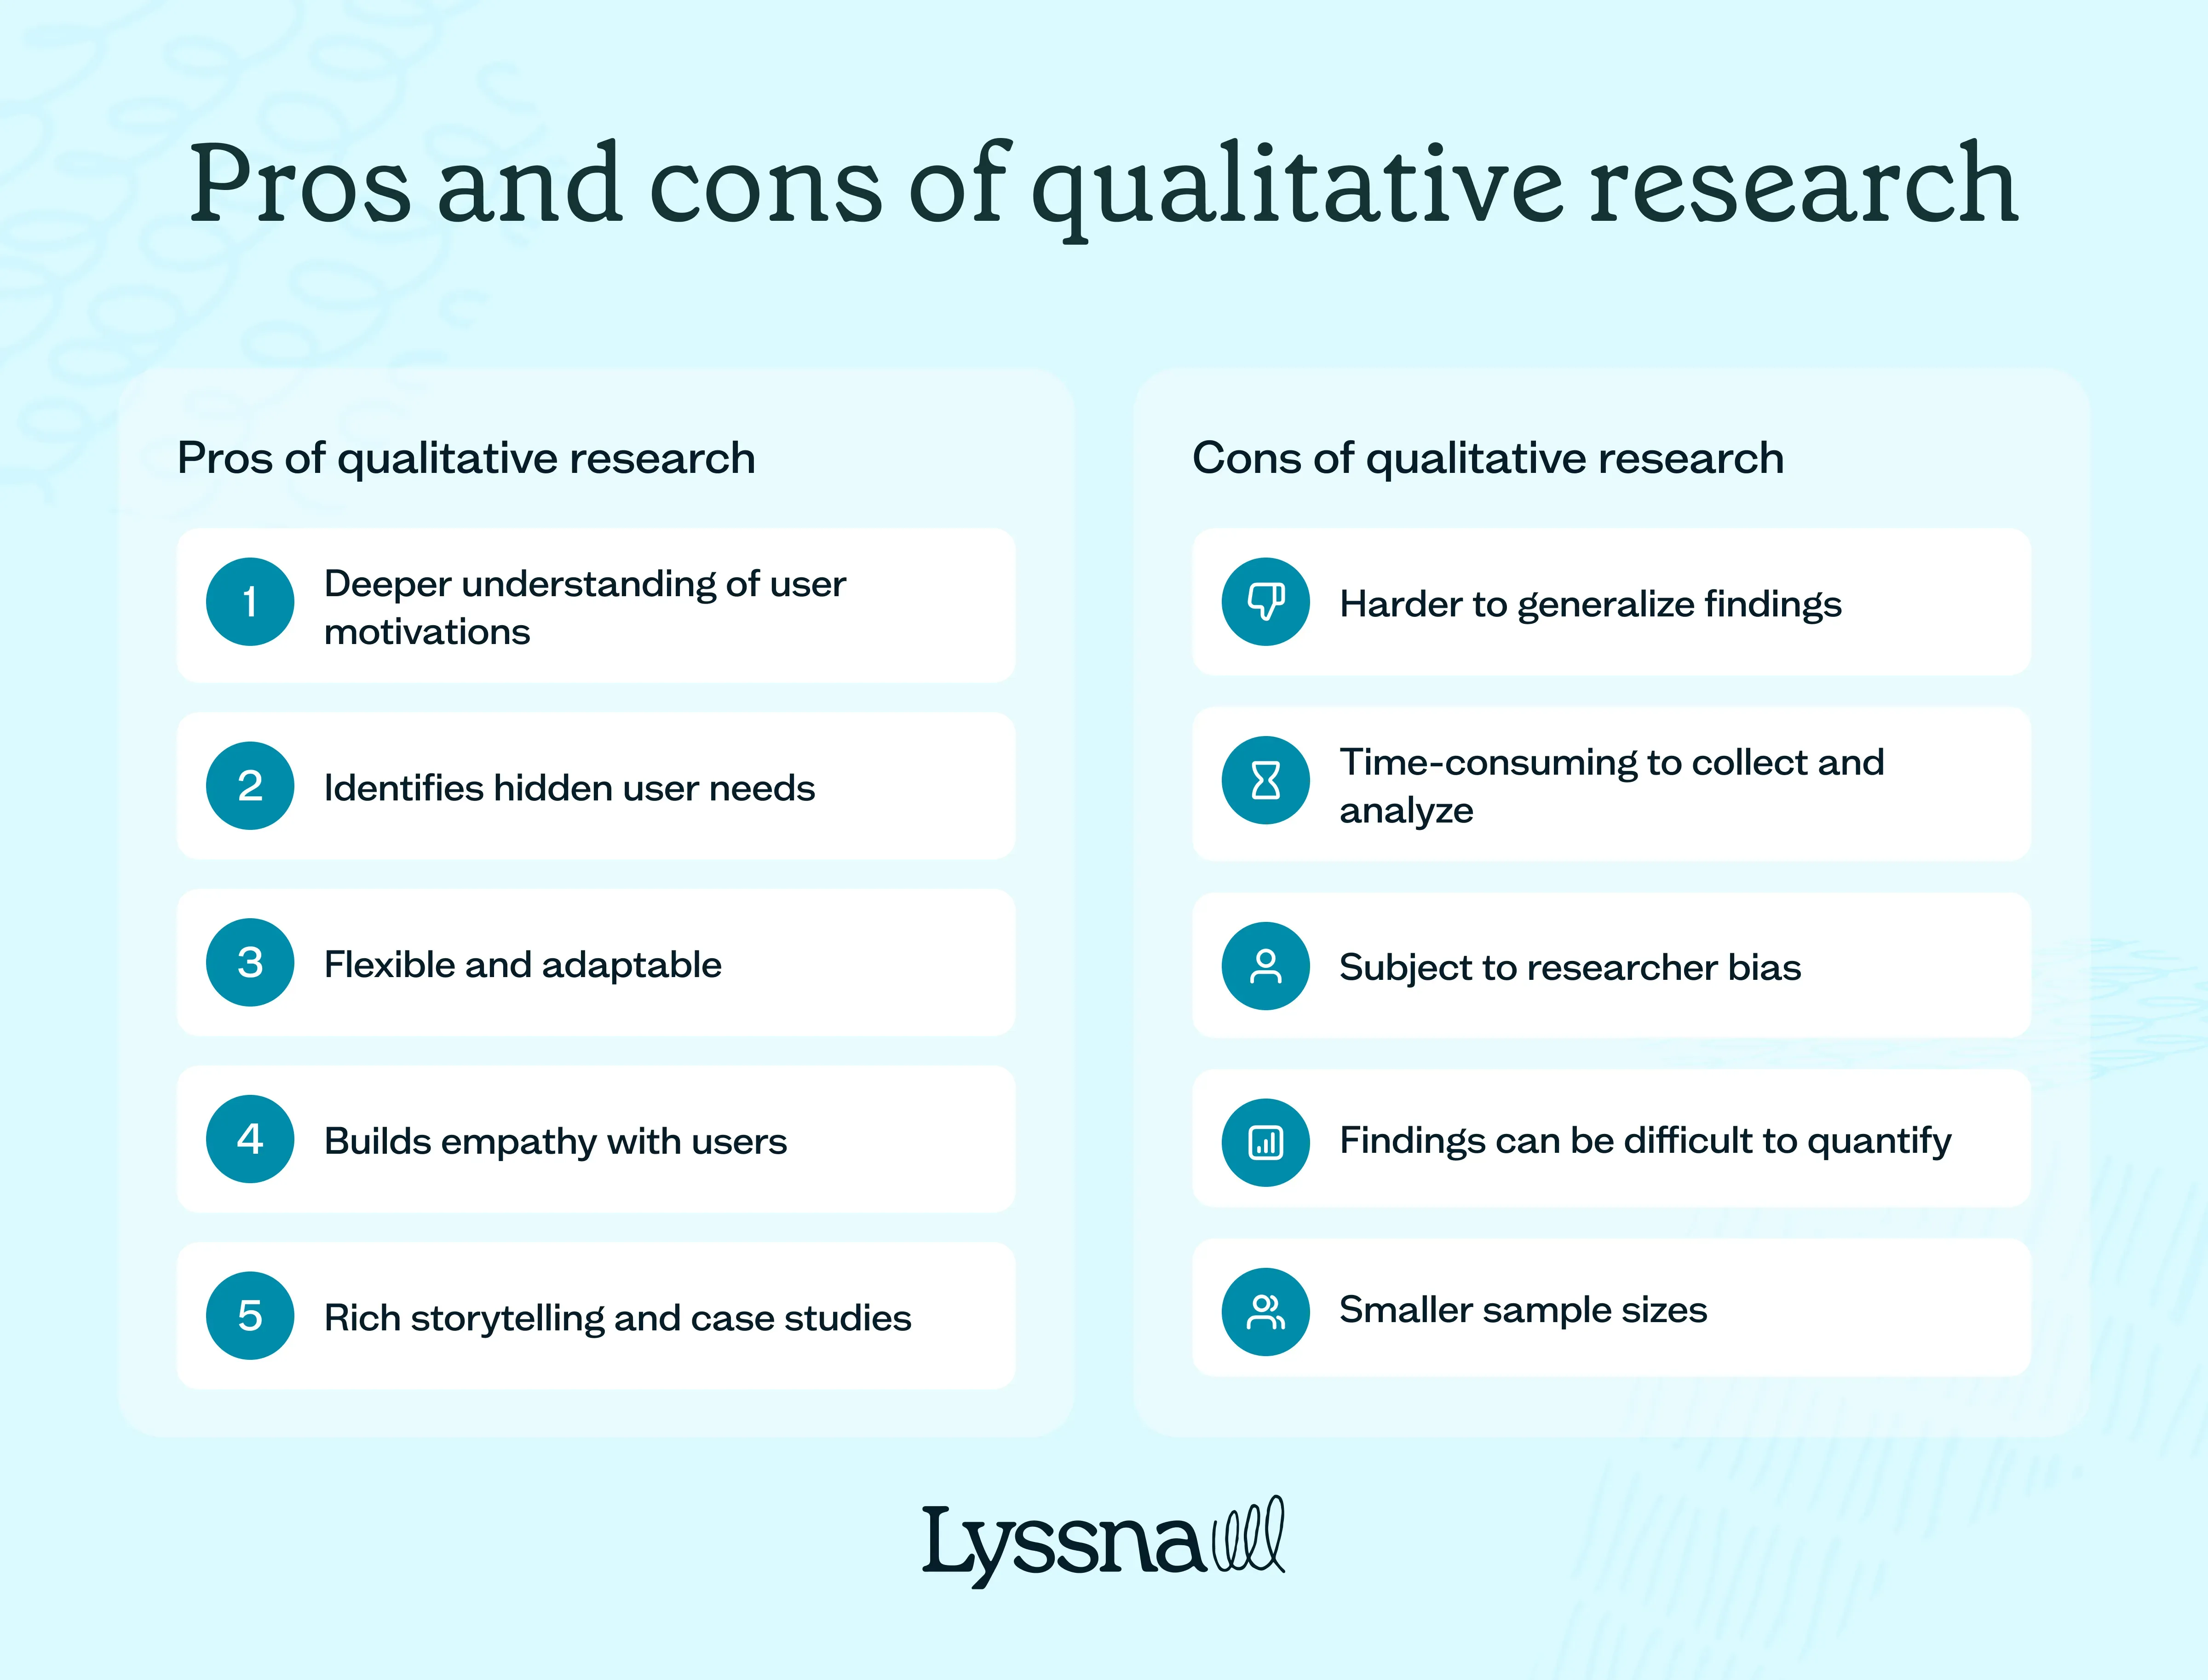
Pros of qualitative research
1. Deeper understanding of user motivations
With qualitative research, you’re not just tracking what people do – you’re uncovering why they do it. This approach lets you tap into user motivations, emotions, and decision-making processes.
2. Identifies hidden user needs
Sometimes users can’t articulate what they need – but they show it through their behavior. Methods like interviews, ethnographic studies, unmoderated user test, and user observations help you see these unspoken needs.
3. Flexible and adaptable
Unlike surveys or experiments, qualitative research isn’t locked into rigid scripts. If a user says something unexpected, you can follow up in real time and explore new paths of discovery.
4. Builds empathy with users
Reading user feedback on a survey is one thing. But hearing a customer’s story directly – in their own words – creates a deeper connection. Empathy drives better design.
5. Rich storytelling and case studies
Qualitative research gives you narrative evidence. Instead of saying, “Users want X feature,” you can share a real story about a customer who faced a specific problem and overcame it with your product.
Cons of qualitative research
1. Harder to generalize findings
Qualitative research usually involves smaller sample sizes, which means feedback might only represent part of your audience. You might hear from 10 users, but that doesn’t mean all 1,000 of your users feel the same way.
How to solve it: Combine qualitative data with quantitative data. Start with qualitative interviews, then validate those findings with larger surveys to see if they hold true for the broader audience.
2. Time-consuming to collect and analyze
Qualitative research takes time. Conducting interviews, running focus groups, and reviewing recordings all require effort – and you’ll need to sift through large amounts of raw data.
How to solve it: Streamline your process by using tools like Lyssna, which helps you run interviews and usability tests efficiently. Use transcripts, tagging, and note-taking features to speed up analysis.
3. Subject to researcher bias
The person conducting the interview or analyzing and sythensizing the data may unintentionally influence the results. Their assumptions, tone, or follow-up questions can shape user responses.
How to solve it: Stick to a script for essential questions but remain open to follow-ups. Involve multiple team members in the analysis to reduce bias.
4. Findings can be difficult to quantify
Unlike survey results, which give you clear percentages and averages, qualitative research produces words, stories, and observations. These findings are incredibly valuable – but harder to turn into concrete KPIs.
How to solve it: Look for recurring themes in user feedback. If multiple users highlight the same pain point, you have a clear direction to prioritize. Use qualitative findings to inform quantitative questions in your next survey.
5. Smaller sample sizes
Because qualitative research requires more time and effort, the sample size is usually much smaller. This means you’re capturing depth but not breadth.
How to solve it: If you need larger-scale validation, use surveys or experiments to confirm the themes you uncover.
What is quantitative research?
Quantitative research is numerical and statistical, making it ideal for objective assessments. If you’re evaluating app analytics like monthly active users or marketing metrics like click-through rates, you’re dealing with quantitative data. It’s often generated with structured tools, like surveys with multiple-choice options, because they can be more clearly counted and quantified as percentages.
Quantitative research aims to be generalizable: its results can be extrapolated to the broader population. For example, consider A/B testing, which is the practice of running two variants on a test audience before rolling one version out to a broader audience. If you were A/B testing two menu configurations with a small sample audience, and one provided much stronger engagement in a target metric, you may then roll the “winning” variant out to all users. In doing so, you would be relying upon the principle of generalizability: the understanding that the sample audience was representative of all users.
Types of quantitative research
There are several different types of quantitative research, each suited to specific goals. If you’re looking for patterns, testing a theory, or tracking user behavior over time, you’ll want to choose the right approach for your needs. Here’s a breakdown of the most common types.
Surveys
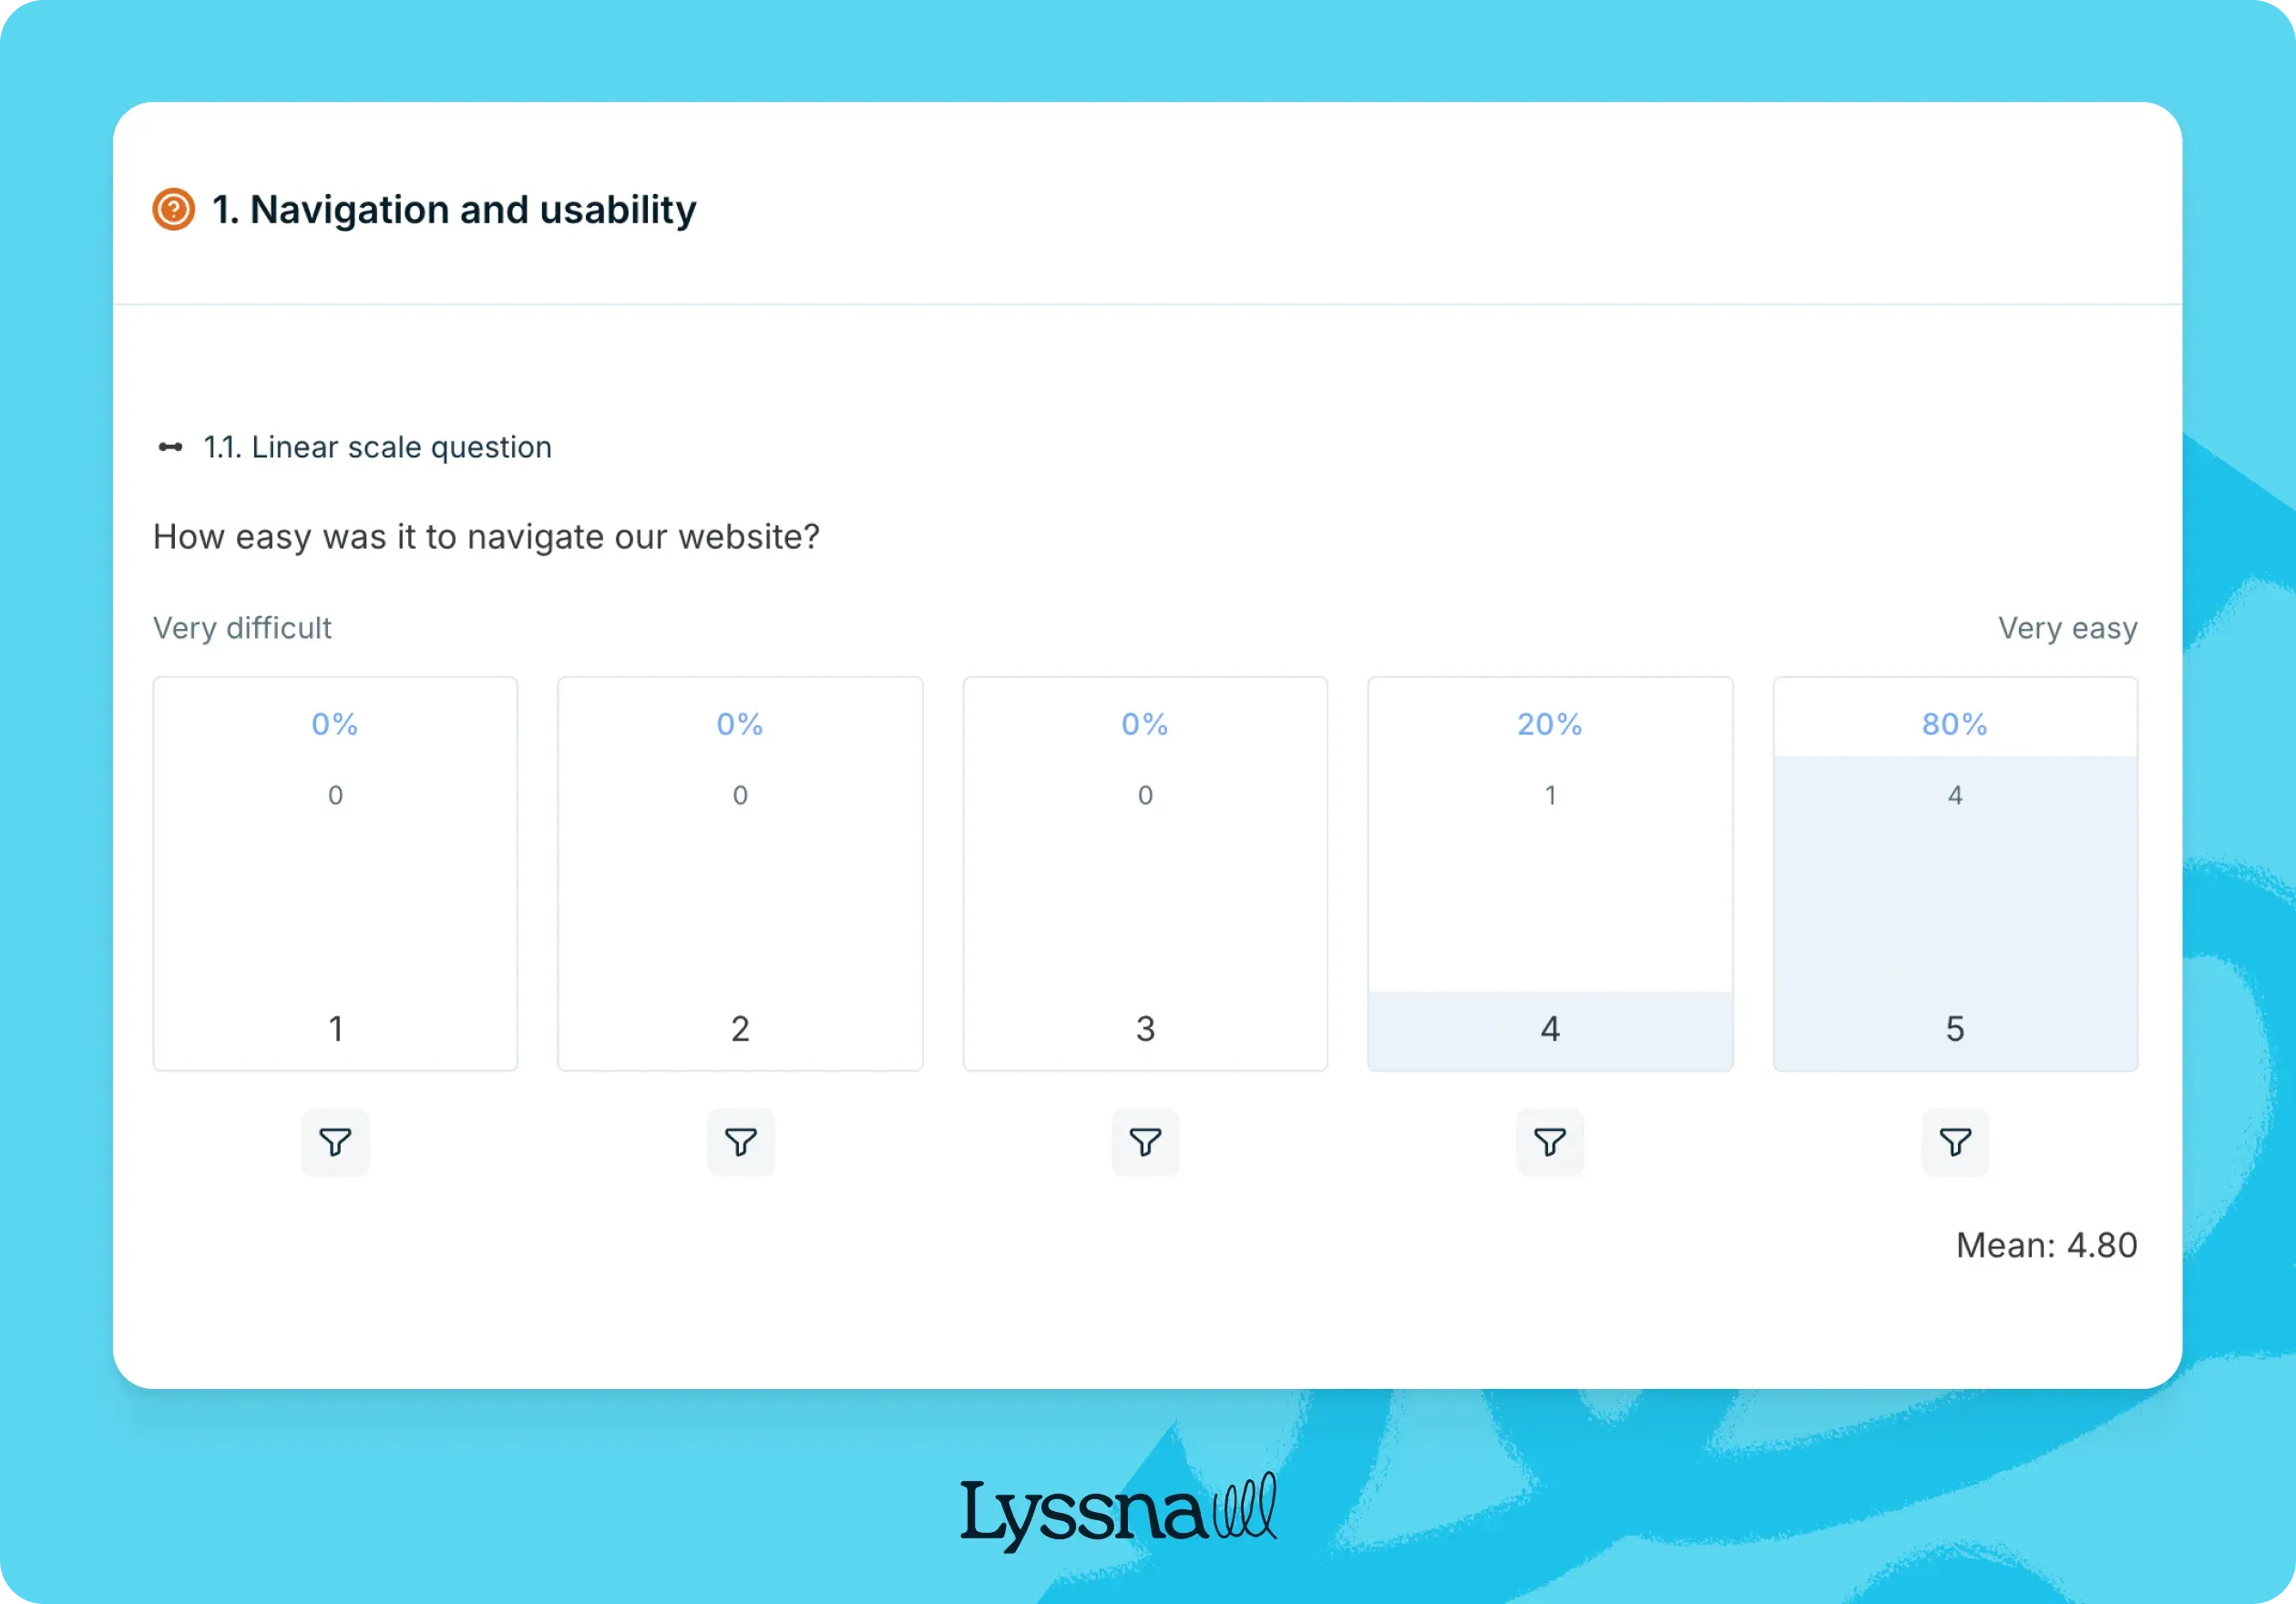
Surveys are one of the most popular methods for collecting quantitative data. You ask a large group of people a series of structured questions – often with multiple-choice or rating-scale answers – and then analyze the results.
When to use surveys:
To gather feedback on user satisfaction, product preferences, or customer needs.
To measure user attitudes at scale – like how many users find your website "easy to navigate."
Example scenario: You launch a survey asking 1,000 users, “On a scale of 1 to 10, how easy is it to complete a purchase on our site (with 1 being the hardest and 10 being the easiest)?”. If 75% of users rate it 8 or higher, you know your checkout process is on track. But if 40% rate it 5 or below, it’s time to look for friction points.
Experimental research
Experimental research is all about testing cause and effect. You introduce a change – like a new layout for a landing page – and see how users respond compared to a control group that didn’t see the change.
When to use experimental research:
To test how design changes affect behavior (like A/B testing).
To understand how different variables (like button color or placement) impact user actions.
Example scenario: You run a quantitative usability test with two versions of your home page. Version A has a green "Sign Up" button, and Version B has a red one. By comparing which version gets more clicks, you can see which design works better.
Longitudinal research
Longitudinal research tracks users' behavior over time, instead of capturing a single snapshot. It helps you see trends, shifts, or patterns that emerge over days, weeks, or months.
When to use longitudinal research:
To monitor user engagement over time – like tracking how many users return to your app each week.
To assess the long-term impact of changes to your product or website.
Example scenario: After launching a new onboarding process, you track user retention over the next 90 days. If user engagement steadily increases, you’ve got evidence that the new onboarding flow is working.
Descriptive research
Descriptive research focuses on describing characteristics, behaviors, or trends within a specific population. Instead of testing a theory or tracking change, it gives you a clear snapshot of what’s happening right now.
When to use descriptive research:
To identify who your users are, what they want, and how they behave.
To create user personas or build a better understanding of your audience.
Example scenario: You analyze data from 2,000 customers to see how many are repeat buyers, how often they purchase, and what types of products they buy. This information helps you build a clear picture of your customer base.
Examples of quantitative research questions
Quantitative research collects measurable data that leads to clear, actionable insights. These questions typically fall into two categories:
Participant-focused questions: Aimed at understanding your audience’s demographics, preferences, and behaviors.
Business-focused questions: Aimed at evaluating performance, identifying trends, and guiding strategy.
When framed correctly, these questions allow you to identify patterns, validate assumptions, and track changes over time. Below, we’ve broken down key examples and when to use them for maximum impact.
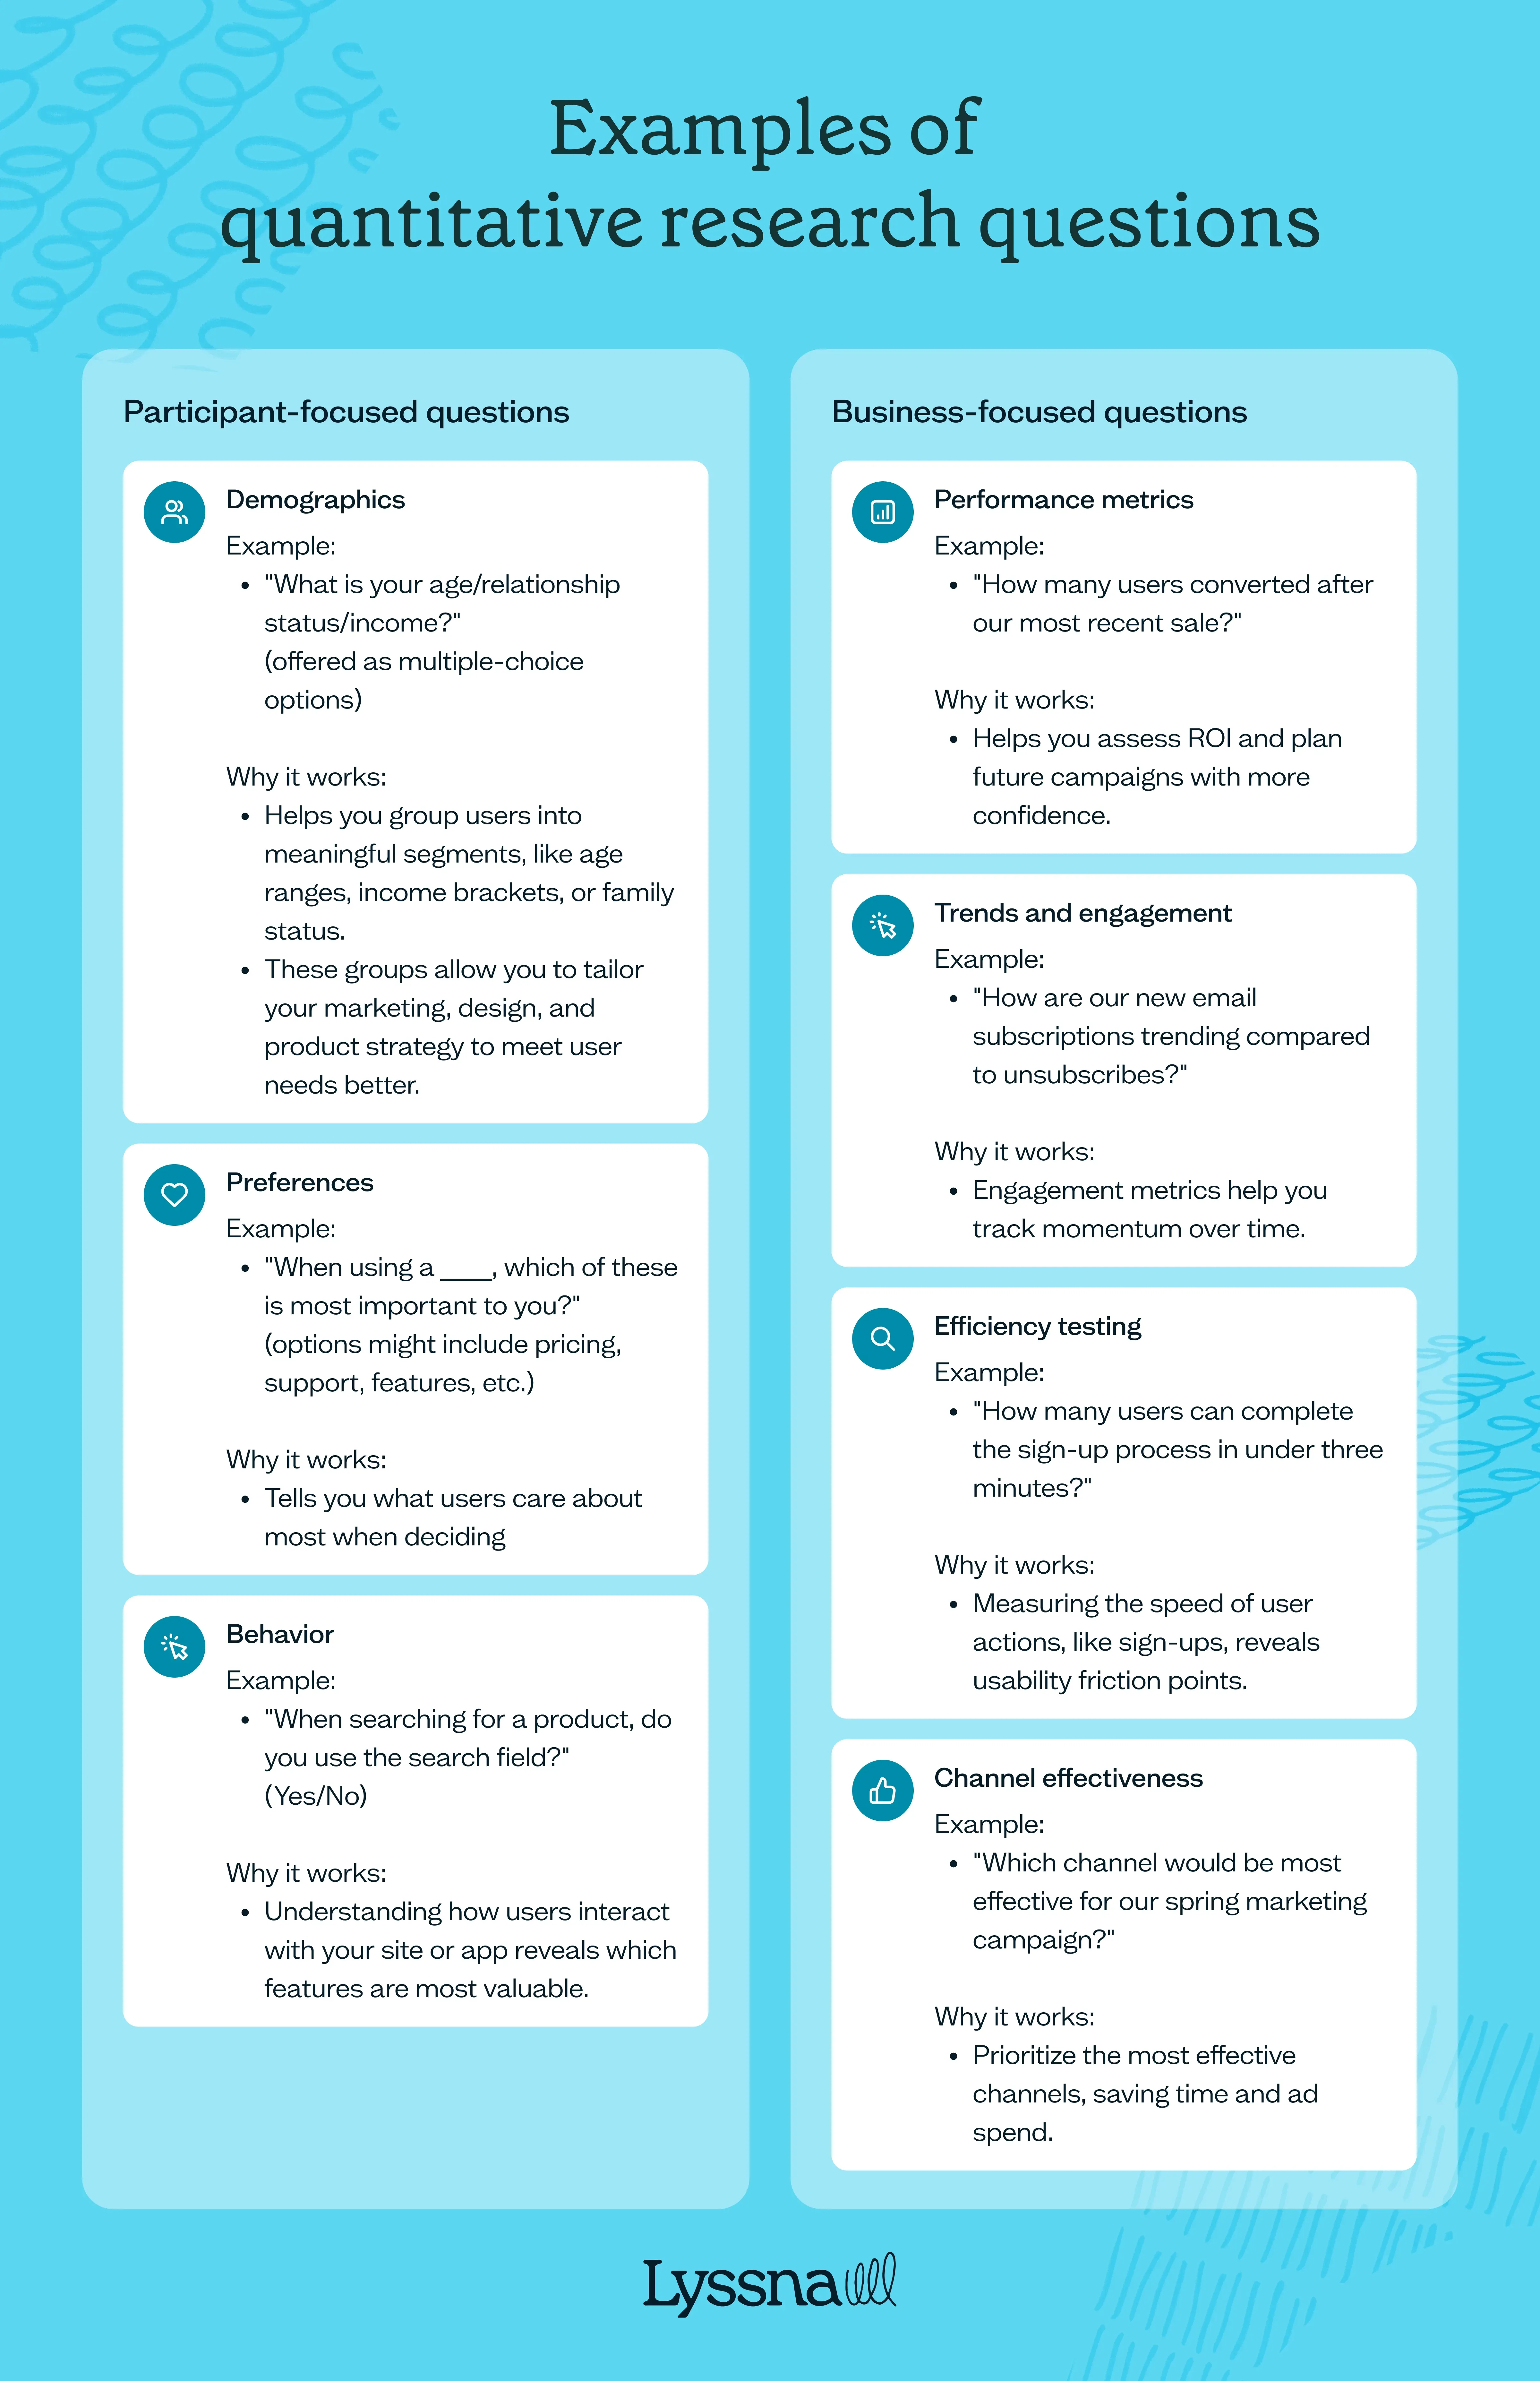
Participant-focused questions
These questions help you understand who your users are, what they want, and how they behave. You’ll often see them in surveys and usability tests. This is helpful for customer segmentation, personalized marketing, and feature prioritization.
1. Demographics
Example: "What is your age/relationship status/income?" (offered as multiple-choice options)
Why it works: Demographic data helps you group users into meaningful segments, like age ranges, income brackets, or family status. These groups allow you to tailor your marketing, design, and product strategy to meet user needs better.
2. Preferences
Example: "When using a ____, which of these is most important to you?" (options might include pricing, support, features, etc.)
Why it works: This question tells you what users care about most when deciding. Knowing if users prioritize price over features (or vice versa) helps you decide which features to promote in product messaging.
3. Behavior
Example: "When searching for a product, do you use the search field?" (Yes/No)
Why it works: Understanding how users interact with your site or app reveals which features are most valuable.
Business-focused questions
These questions focus on performance, efficiency, and strategic decisions. They’re used in marketing, growth, and new product development strategy to track progress, spot trends, and optimize decision-making.
1. Performance metrics
Example: "How many users converted after our most recent sale?"
Why it works: If you’re tracking the effectiveness of campaigns, promotions, or seasonal sales, this question tells you exactly how well they performed. It helps you assess ROI and plan future campaigns with more confidence.
2. Trends and engagement
Example: "How are our new email subscriptions trending compared to unsubscribes?"
Why it works: Engagement metrics help you track momentum over time. By spotting whether subscription growth is outpacing unsubscribes, you can see if your strategy is working – or if it’s time to adjust your email marketing efforts.
3. Efficiency testing
Example: "How many users can complete the sign-up process in under three minutes?"
Why it works: Measuring the speed of user actions, like sign-ups, reveals usability friction points.
4. Channel effectiveness
Example: "Which channel would be most effective for our spring marketing campaign?"
Why it works: By directly asking users where they’re most likely to engage, you can prioritize the most effective channels, saving time and ad spend.
5. A/B testing insights
Example: "Does the CTA ‘learn more’ entice more clickthroughs than the CTA ‘explore’?"
Why it works: Small changes in wording, button design, or layout can have a huge impact on conversion rates. By running A/B tests, you can measure which option performs best and apply it across your site, emails, or ads.
Pros and cons of quantitative research
Just like any research method, quantitative research has its strengths and limitations. It’s great for collecting large amounts of data, but it’s not always the best way to understand the deeper “why” behind user behavior. Here’s a closer look at the pros and cons to help you decide when to use it.
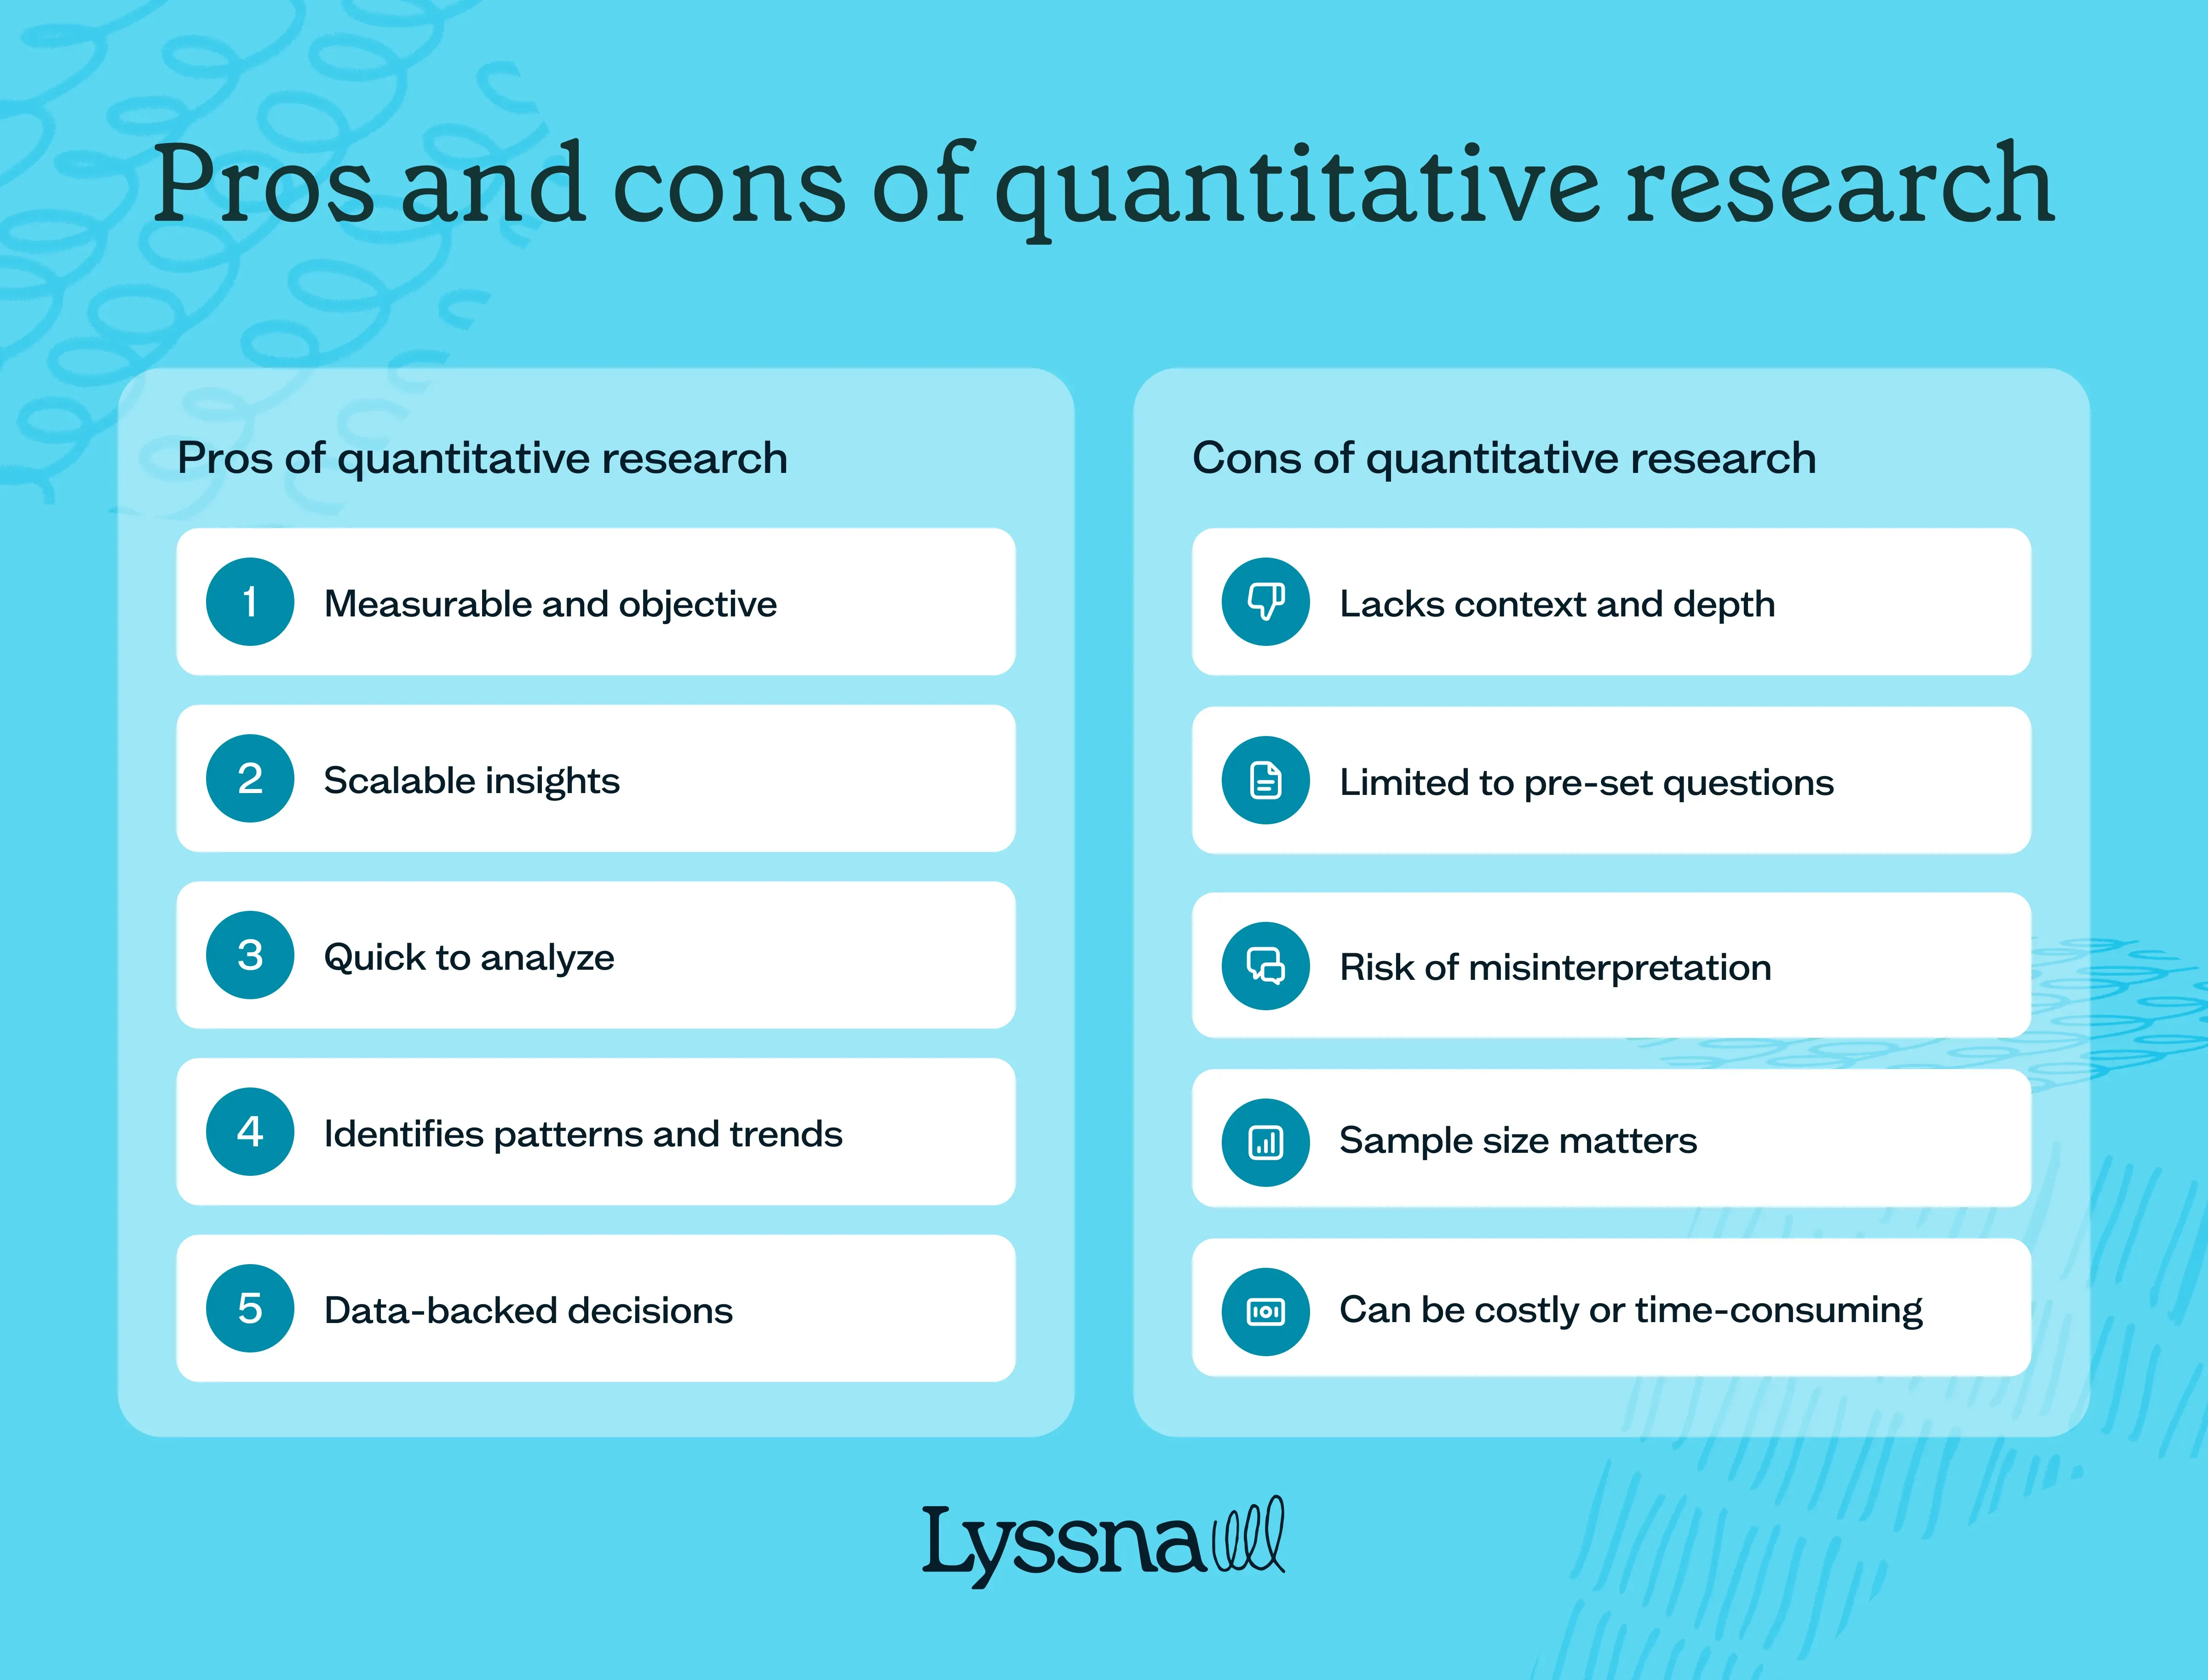
Pros of quantitative research
1. Measurable and objective
With quantitative research, you’re working with numbers – not opinions. This means your findings are objective and easy to analyze. Instead of “most users like this feature,” you can say, “78% of users rated this feature 9/10 or higher.”
2. Scalable insights
Since quantitative research often uses larger sample sizes, you can gather data representing your entire user base – not just a small handful of people.
3. Quick to analyze
Unlike qualitative data, which needs to be read, coded, and categorized, quantitative data is fast to process. Once you have your numbers, you can instantly create charts, graphs, and summaries.
Why it matters: If you’re on a tight timeline or need quick feedback, quantitative research is much faster to analyze than interview transcripts or focus group notes.
4. Identifies patterns and trends
Quantitative data helps you spot patterns over time. You can track changes in user behavior week by week, month by month, or even year by year.
Why it matters: This long-term perspective helps you understand what’s changing and when.
5. Data-backed decisions
When you have hard numbers, it’s easier to justify decisions. You can show stakeholders the precise data that backs your strategy — no guesswork required.
Why it matters: Whether you’re making design changes or pitching a new product idea, hard data gives you the confidence to move forward.
Cons of quantitative research
1. Lacks context and depth
Numbers tell you what’s happening, but not why it’s happening. You’ll know that 45% of users dropped off at checkout, but you won’t know if it’s because the form is too long, the shipping costs are too high, or something else entirely.
How to solve it: Combine quantitative data with qualitative findings. Interviews or usability tests can help you uncover the root cause of user behavior.
2. Limited to pre-set questions
Quantitative research relies on structured questions, like multiple-choice or ratings. If you forget to ask a crucial question, you won’t get the answers you need.
How to solve it: Do some qualitative research first. Interviews can reveal questions you might not have thought to ask in a survey.
3. Risk of misinterpretation
Numbers don’t always tell the full story. For example, a 20% drop in daily active users might seem alarming – but if it happened over a holiday weekend, the context changes everything.
How to solve it: Always look for external factors that could explain the data. Pair quantitative findings with qualitative analysis to avoid misinterpreting trends.
4. Sample size matters
If your sample size is too small, your data won’t be statistically significant. This can lead to misleading conclusions. For instance, if only 5 people took a survey, a 60% response rate isn’t meaningful.
How to solve it: Aim for larger sample sizes whenever possible – especially if you’re trying to generalize findings to your whole user base.
5. Can be costly or time-consuming
While quantitative research is fast to analyze, recruiting a large sample can be expensive and time-consuming – especially if you need a very specific audience.
How to solve it: Research panels, like the one from Lyssna, can make recruitment more affordable. This allows you to scale up your research without breaking your budget.
Balancing qualitative and quantitative approaches
When it comes to user research, it’s not about qualitative vs quantitative – it’s about how you can use them together. Each method has strengths that the other doesn’t. While qualitative research tells you the “why,” quantitative research shows you the “what” and “how much.” When you combine them, you get a more complete picture of your users.
Here’s how to balance qualitative and quantitative approaches throughout the product development cycle.
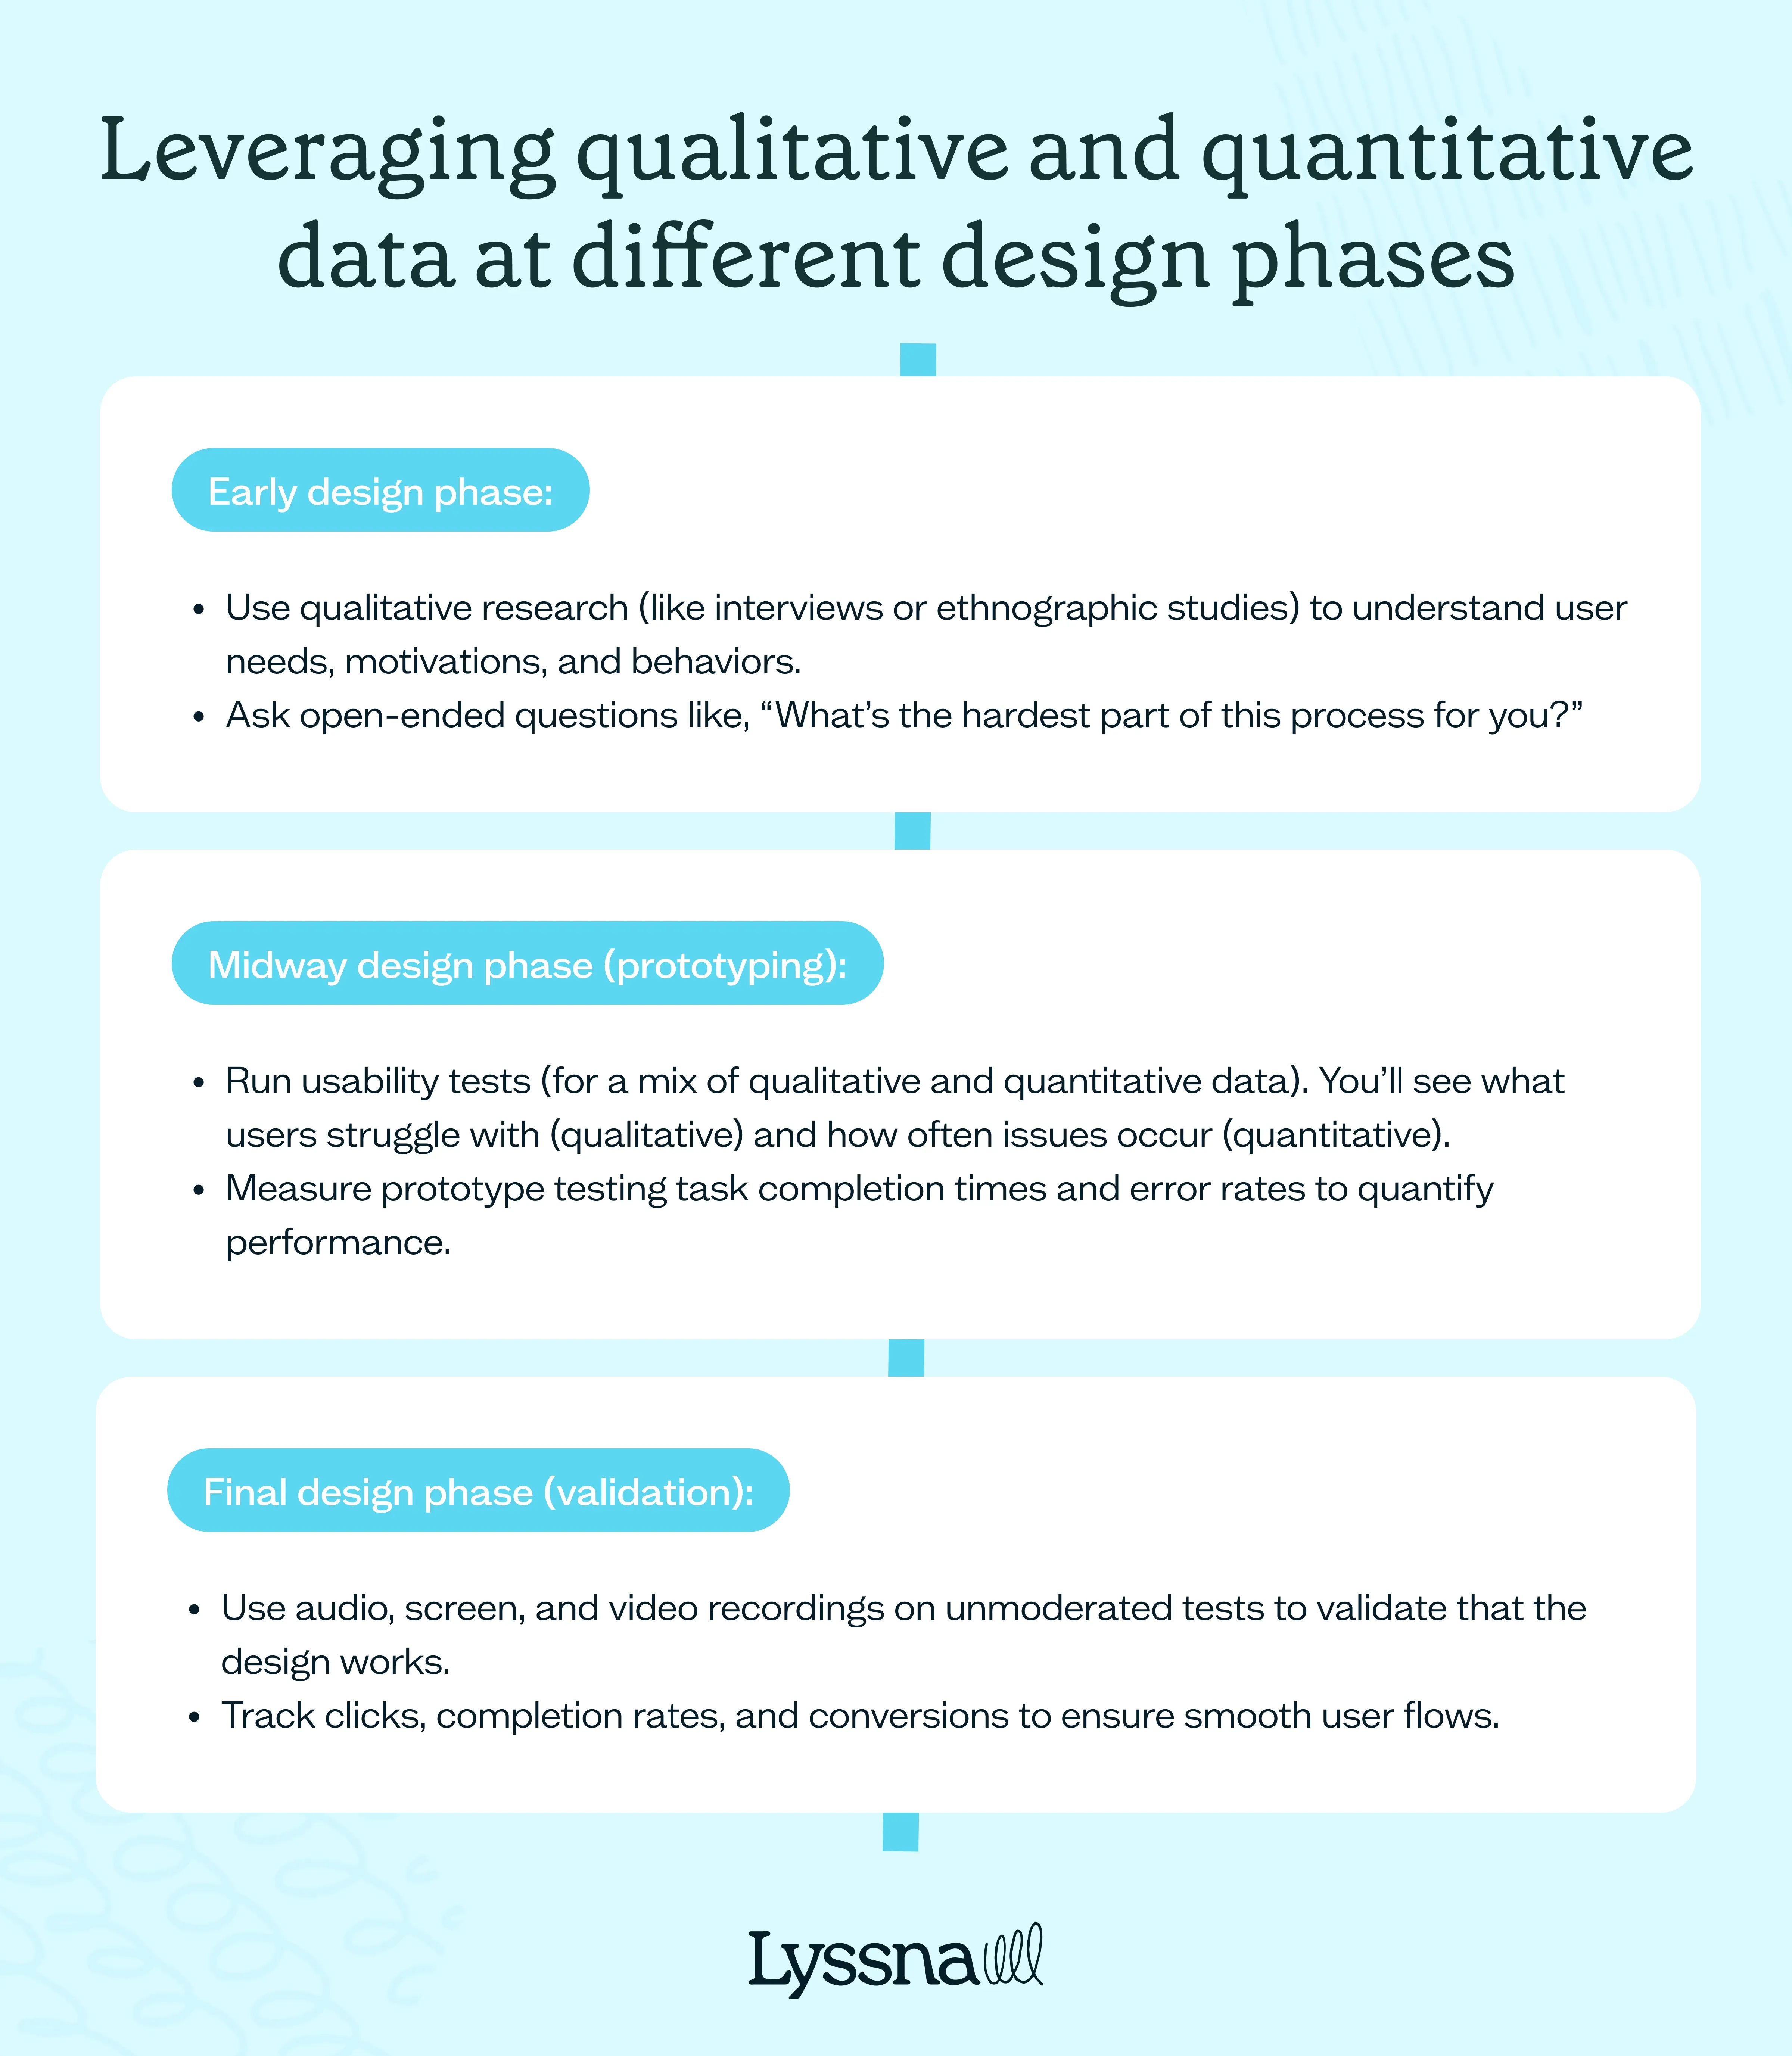
Leveraging qualitative and quantitative data at different design phases
Different design phases call for different types of findings. Sometimes, you’ll want to understand user pain points (that’s where qualitative shines), and other times, you’ll need hard data to guide decisions (that’s where quantitative comes in).
Early design phase:
Use qualitative research (like interviews or ethnographic studies) to understand user needs, motivations, and behaviors.
Ask open-ended questions like, “What’s the hardest part of this process for you?”.
Midway design phase (prototyping):
Run usability tests (for a mix of qualitative and quantitative data). You’ll see what users struggle with (qualitative) and how often issues occur (quantitative).
Measure prototype testing task completion times and error rates to quantify performance.
Final design phase (validation):
Use audio, screen, and video recordings on unmoderated tests to validate that the design works. Track clicks, completion rates, and conversions to ensure smooth user flows.
By adjusting your approach at each stage, you’ll avoid costly missteps and ensure that your product is both useful and usable.
Post-launch
Once your product is live, you’re not done – in fact, you’re only getting started! Post-launch research helps you keep improving and adapting to changing user needs.
Here’s how qualitative and quantitative research can support you after launch:
Quantitative: Run live website testing to track usage metrics, like drop-off rates, feature adoption, and churn rates.
Qualitative: Use in-depth interviews or surveys to ask “What’s missing?” or “What’s most frustrating about this feature?”.
Example: If you notice a drop-off at the payment step (quantitative data), you might run follow-up interviews with users to figure out why they’re leaving (qualitative insights). Maybe it’s because the form is too long or shipping fees are unclear – two issues that wouldn’t be obvious from metrics alone.
Cross-validate your findings
Relying on one data source can lead to false conclusions. You might see that 40% of users abandon their carts, but without qualitative data, you don’t necessarily know why. Cross-validation means you're using both qualitative and quantitative data to check your findings, and this is where ux research synthesis plays a crucial role – helping you bring together diverse insights for a complete understanding.
How it works:
Start with qualitative research – run user interviews or live website testing to identify potential issues.
Use quantitative research to check if these issues are widespread.
Example: If interviewees mention that the "Apply Promo Code" field is hard to find, you might create a survey asking 1,000 users, “Did you have trouble finding the promo code field during checkout?”. If 70% say “Yes,” you now have both the why (from interviews) and the what (from survey data) to drive a change.
Integrate findings into reporting
When reporting your findings to stakeholders, you’ll want to combine stories with hard numbers. This approach is more compelling and persuasive.
Here’s how to do it:
Use quantitative data to show the scale of the problem (e.g. “30% of users drop off at this step”).
Add quotes or video clips to humanize it (e.g. “One user said, ‘I couldn’t figure out where to enter my discount code.’”).
Why it works: Data alone might not be enough to convince a stakeholder. But when you pair a powerful story with hard numbers, you create an emotional connection that drives action.
Stay transparent
Research isn’t about proving you’re right – it’s about uncovering the truth. Be honest with your data, even if it’s not what you expected. If users aren’t responding well to a feature, acknowledge it and adjust.
How to do it:
Don’t cherry-pick the "good" data to share with stakeholders. Present an overview of the full story – both wins and losses.
Use qualitative insights (like interview clips) to highlight areas for improvement.
Show stakeholders the quantitative impact of changes, like higher conversion rates or faster task completion.
Being transparent builds trust, encourages open dialogue, and leads to better, user-centered decisions.
The bottom line?
Don’t think of qualitative and quantitative as “either/or.” Use them together. Start with qualitative methods to explore and understand user needs. Then, use quantitative approaches to validate and measure those insights at scale.
Start gathering better research data
Stop choosing between qualitative and quantitative data. Get started with Lyssna's free plan today and access both rich user feedback and meaningful metrics in one platform.
How Lyssna can help
If you’re looking for a way to blend qualitative and quantitative research design seamlessly, Lyssna has you covered. As a comprehensive user research platform, Lyssna makes it easy to run moderated and unmoderated studies – giving you the best of both worlds.
Here’s how Lyssna helps you get the data you need:
Access to 690K+ participants: Get fast access to a global pool of participants, with demographic and psychographic targeting.
Speed and simplicity: Most orders are fulfilled in under 30 minutes, so you can get rapid feedback and move faster.
Affordable research: Run unlimited tests, surveys, and interview studies with low recruitment costs (just $1 per credit).
Qualitative + quantitative: Combine moderated interviews with quantitative data from surveys and usability tests to cross-validate your findings.
Secure and compliant: Lyssna is SOC2, GDPR, and CCPA compliant, so you can trust that your data is safe.
Whether you need to understand why users behave a certain way or how many users are affected by an issue, Lyssna gives you the flexibility to do both – all on one platform.
You may also like these articles


Try for free today
Join over 320,000+ marketers, designers, researchers, and product leaders who use Lyssna to make data-driven decisions.
No credit card required

