This template is for:
User feedback
Product
Design
Research
Usability testing
Created by:
Lyssna
Overview
Evaluate the usability of your digital product or service with our System Usability Scale (SUS) template.
The SUS is a useful way to measure how users feel about your website or app after they’ve used it. After someone interacts with your product, you show them ten fixed statements about it. These statements cover how easy it is to use, how complex it is, how much they like it, and how consistent it is.
You then ask test participants to answer each statement on a Likert scale of one to five. One means they strongly disagree with the statement, and five means they strongly agree. The statements alternate between positive and negative sentiments, which means that participants can’t simply choose the same answer for every statement. They have to think about each one carefully.
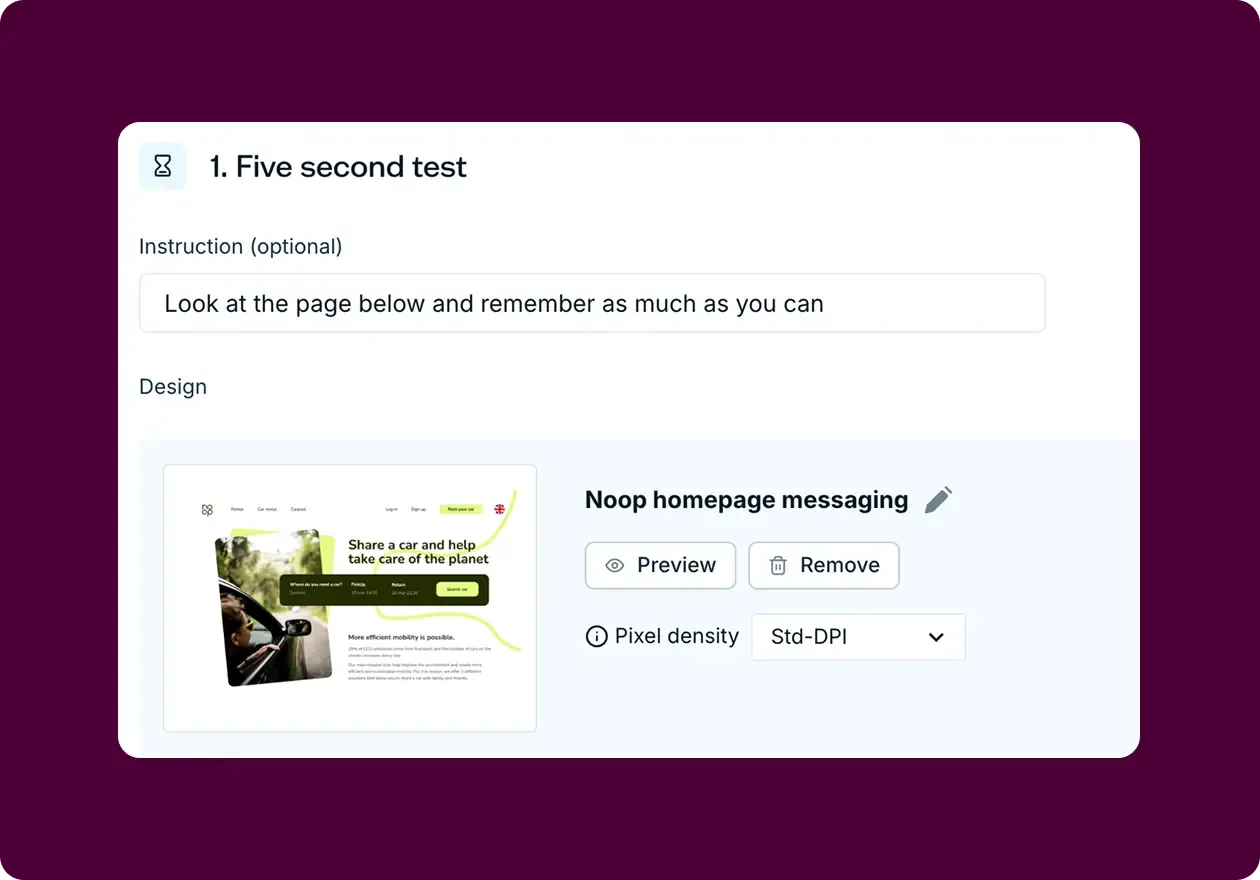
A SUS survey can be added after a task-based usability test, like a prototype test. This template includes a prototype test section, followed by the ten SUS survey questions. You can simply replace the Figma prototype link with your own link and update the instructions.
Note that the survey questions are marked as required – this is because you need all the responses to correctly calculate your SUS score.
How to calculate your SUS score
Once you’ve received your test responses, you can download the results as a CSV and calculate each participant's SUS score in the following way:
For the odd-numbered questions (1, 3, 5, 7, 9), subtract 1 point from the score.
[Participant rating] – 1 = ___ points
For the even-numbered questions (2, 4, 6, 8, 10), subtract the score from 5.
5 – [Participant rating] = ___ points
Add up the new values. Then, multiply this by 2.5 to get an individual participant’s score.
Once all the calculations are done, you’ll have scores out of 100. This isn't a percentage, but it's a simple way to see each score. You can then average all the participant scores or look at them across different demographic groups or personas to learn more about the data.
To save you from doing manual calculations, we've designed a handy Google Sheets template for you! Simply download your results as a CSV, import them into the Google Sheet, and the SUS scores will automatically be calculated for you. Click here to make a copy of the Google Sheets template. Instructions are included on the first tab.
What’s a good SUS score?
An average SUS score is 68, so anything above this could be considered above average and anything below could be considered below average. But the best way to interpret your SUS score is to convert it into a percentile. We cover this in more detail in our article on measuring product usability with the System Usability Scale.
This template will help you discover
Your SUS score, which you can use to guide iterative improvements.
How your product compares to industry standards and competitors.
How users feel about your digital product or service after they’ve interacted with it.
Areas of ease and difficulty within your design.
See an example of the results in Lysnna and an example of the SUS score calculations using our Google Sheets template.
How to use this template
Click on the "Use this template" button and log in to your Lyssna account. Don't have an account yet? Start exploring with a free plan.
Modify the prototype test section of the test to suit your needs.
Preview your test or press save and continue to recruit your participants.
Set your test live and wait for your results.
Download your results as a CSV.
Make a copy of our Google Sheets template and import your results.
Frequently asked questions
You may also like these templates
We used to spend days collecting the data we can now get in an hour with Lyssna. We're able to get a sneak preview of our campaigns' performance before they even go live.
Aaron Shishler
Copywriter Team Lead at monday.com


Try for free today
Join over 320,000+ marketers, designers, researchers, and product leaders who use Lyssna to make data-driven decisions.
No credit card required


