14 Nov 2025
|13 min
Usability metrics
Understand usability metrics and their importance. Learn how to measure progress, gauge user satisfaction, efficiency, and effectiveness.

One of the hallmarks of good user experience design is that it shouldn't seem obvious to the user. But this poses a problem for teams tasked with making that design: How do you show that the design iterations you've made have improved the user experience? If the end state is something that feels obvious to users, how do you illustrate meaningful progress?
Usability metrics are a helpful way of marking this progress. Usability testing generates a wealth of rich qualitative data about the usability of a given system, website, or piece of software, generally in the form of quotes, screen captures, and video. But usability metrics also provide quantitative data – that is, hard numbers – that enrich and substantiate all of those qualitative insights. Qualitative and quantitative data complement each other to provide UX researchers and other stakeholders with a full picture of how effective, efficient, and satisfying the given product is to use.
Metrics also provide the precise numbers necessary to determine whether various decisions – whether it’s redesigning a product or an A/B test of a seemingly minor UI element – are the right choice. Let’s dive into some scenarios in which usability metrics are useful and explore some of the most important ones to understand.
What are usability metrics?
Usability metrics are the specific measurements and statistics used to review the usability of a product or service. The concept of “usability” can be further subdivided into three qualities:
Effectiveness: How easy is it for users to accomplish a given task? These metrics determine whether or not users can complete tasks and goals.
Efficiency: How quickly can users accomplish these tasks? These metrics determine the cognitive resources it takes for a user to complete tasks and goals.
Satisfaction: How happy are users with their experience accomplishing these tasks? While subjective in nature, these metrics can be quantified and used to determine the comfort and accessibility of a website, app, or product.
Understanding usability testing
Usability testing is the process of methodically gauging how easy it is for users to perform various tasks. Without it, there can be no usability metrics.
Let’s say you’re brought in to help redesign a pet food website. After spending a lot of time with various design and marketing teams, you’ve produced a new website that’s ready to roll out to users. First, though, you’ll want to do some usability testing, monitoring users either remotely or in-person as they perform various tasks.
Usability testing for the pet food website may task users with making an account (task 1) and purchasing some grain-free cat food (task 2). You can use moderated usability testing to monitor users while they perform these tasks, taking note of the difficulties users face and whether these difficulties are a function of design inefficiencies or human error. You can then seek to iterate on the designs to maximize the most desirable metrics and minimize errors. It can be done at any point in the design process, but generally happens after exploratory thinking is complete and there's some sort of working prototype for users to manipulate, ideally guided by a clear user test plan.
Why measure usability?
It’s worth noting that usability metrics sometimes require more usability testing than is necessary if all you’re looking for is qualitative data. This is because reliable qualitative data can be obtained with just a few usability tests, generating the sort of insights and quotes common in various types of qualitative studies that help guide further design iterations.
On the other hand, obtaining valid quantitative metrics may require a larger number of tests to make sure that the numbers aren’t skewed by one or two aberrations.
That being said, for many projects, they’re worth the effort. Usability metrics aid UX researchers, UX designers, and anyone who conducts research in a variety of ways, serving as key examples of quantitative research methods that offer reliable, data-driven insights into user behavior. For more comprehensive insights, check out our guide on ux research insights to better understand how data-driven decisions can enhance user experience.
Assessing success: If UI tweaks often seem “obvious” to observers after the fact, usability metrics can provide solid data that these tweaks measurably improved performance and user satisfaction—especially when you have a clear understanding of what is UI and how it impacts user interactions. In the same manner, usability metrics help define KPIs, giving internal design teams targets to aim for.
Selling initiatives to stakeholders: If anecdotal feedback suggests a pricy redesign is in order, usability metrics can provide a numerical argument to make the case. Usability metrics show how investments in UX yields improvements to the bottom line.
Complementing qualitative research: A simple video or quote from a user can be remarkably convincing, but it’s even more compelling when paired with numbers—an ideal demonstration of how qualitative vs quantitative research methods work together to create deeper usability.
Determining user satisfaction: If one of the goals of a site or app is to make users happy, usability metrics determine the simple pleasurability of performing baseline tasks.
Evaluating redesigns: A redesign may be more aesthetically appealing, but if it increases the number of errors or makes it more difficult for users to complete a purchase, it needs some more product iteration.
Prioritizing product improvements: Rich data yielded from users across a suite of tasks helps spotlight areas of possible down-the-road improvements. For example, if users completed most tasks easily but found the process of requesting a refund unsatisfying, that may suggest an area for the design team to prioritize.

How to measure usability
As with any area of data analysis, it’s helpful to approach how you'll measure usability with a plan so that you don’t just end up clicking around looking at numbers. (While that can be fun, it’s not super efficient.) One of the keys to effectively employing usability metrics in user-centered design is to pick the right metrics, starting with the key business objectives or questions that initiated the research in the first place.
For example, for an app primarily designed for entertainment, the most important metrics may be the ones that measure user satisfaction, e.g. you want users to enjoy their time on the app. If you’re working on software that monitors safety throughout a building, efficiency may be the most important, e.g. you want users to be able to act quickly. On the other hand, if you’re working on a redesign for a business with a key focus on improving conversion rates quarter-over-quarter, you may be looking at effectiveness more closely, e.g. you want to make sure users can complete key tasks like purchasing items and making an account.
Let’s drill down on specific metrics that can help measure a design’s ability to achieve these goals.
1. Completion rate
Completion rate is a measurement of effectiveness that measures the percentage of users who successfully complete a task. Also sometimes called task success rate, it's one of the most important usability metrics. Completion can be perceived as a binary quality, with users who complete a task as 1 and users who fail to do so as a 0. The rate is then tabulated using the following formula:
Completion rate = (Number of successful users / Total number of users) x 100
In general, you want the completion rate as high as possible.
Completion rate can also be modified to measure indirect completions. This creates more nuanced data, for example, around a subcategory of people who are able to complete the core task but take a longer route to do so.
Completion rate can be enriched even further using gradients, assigning levels to success. For example, you may use a four-level scale, where one class is a group that efficiently completes the task, the next class completes the task but makes some minor errors, the third class completes the task but makes major errors, and the fourth class fails to complete the task at all. This data can be conveyed in a stacked bar graph that shows visually how well users can complete different tasks.
2. Number of errors
Number of errors is an effectiveness metric that tabulates the number of errors a user makes while performing the given tasks. It’s worth noting these errors are different from bugs or software errors, but rather are human errors made in the process of completing the task.
You can think of errors in two ways:
“Slips” are errors that occur due to lapses in attention or motor skills, leading users to make unintended actions, like a typo. All users are humans, so these are unavoidable.
“Mistakes” are errors that result from a misunderstanding of the interface or poor decision-making, and should be minimized by the design.
The number of errors can be calculated by tabulating all of the errors a user makes while completing a given task. The lower this number is, the better.
3. Task time
Task time is an efficiency metric that measures the time taken by users to complete a specific task. A shorter task time often indicates a more efficient design. It can be tabulated using the following formula:
Task time = End time - Start time
If a user starts a task five minutes into a test and completes the task 10 minutes into the task, that task time is five minutes.
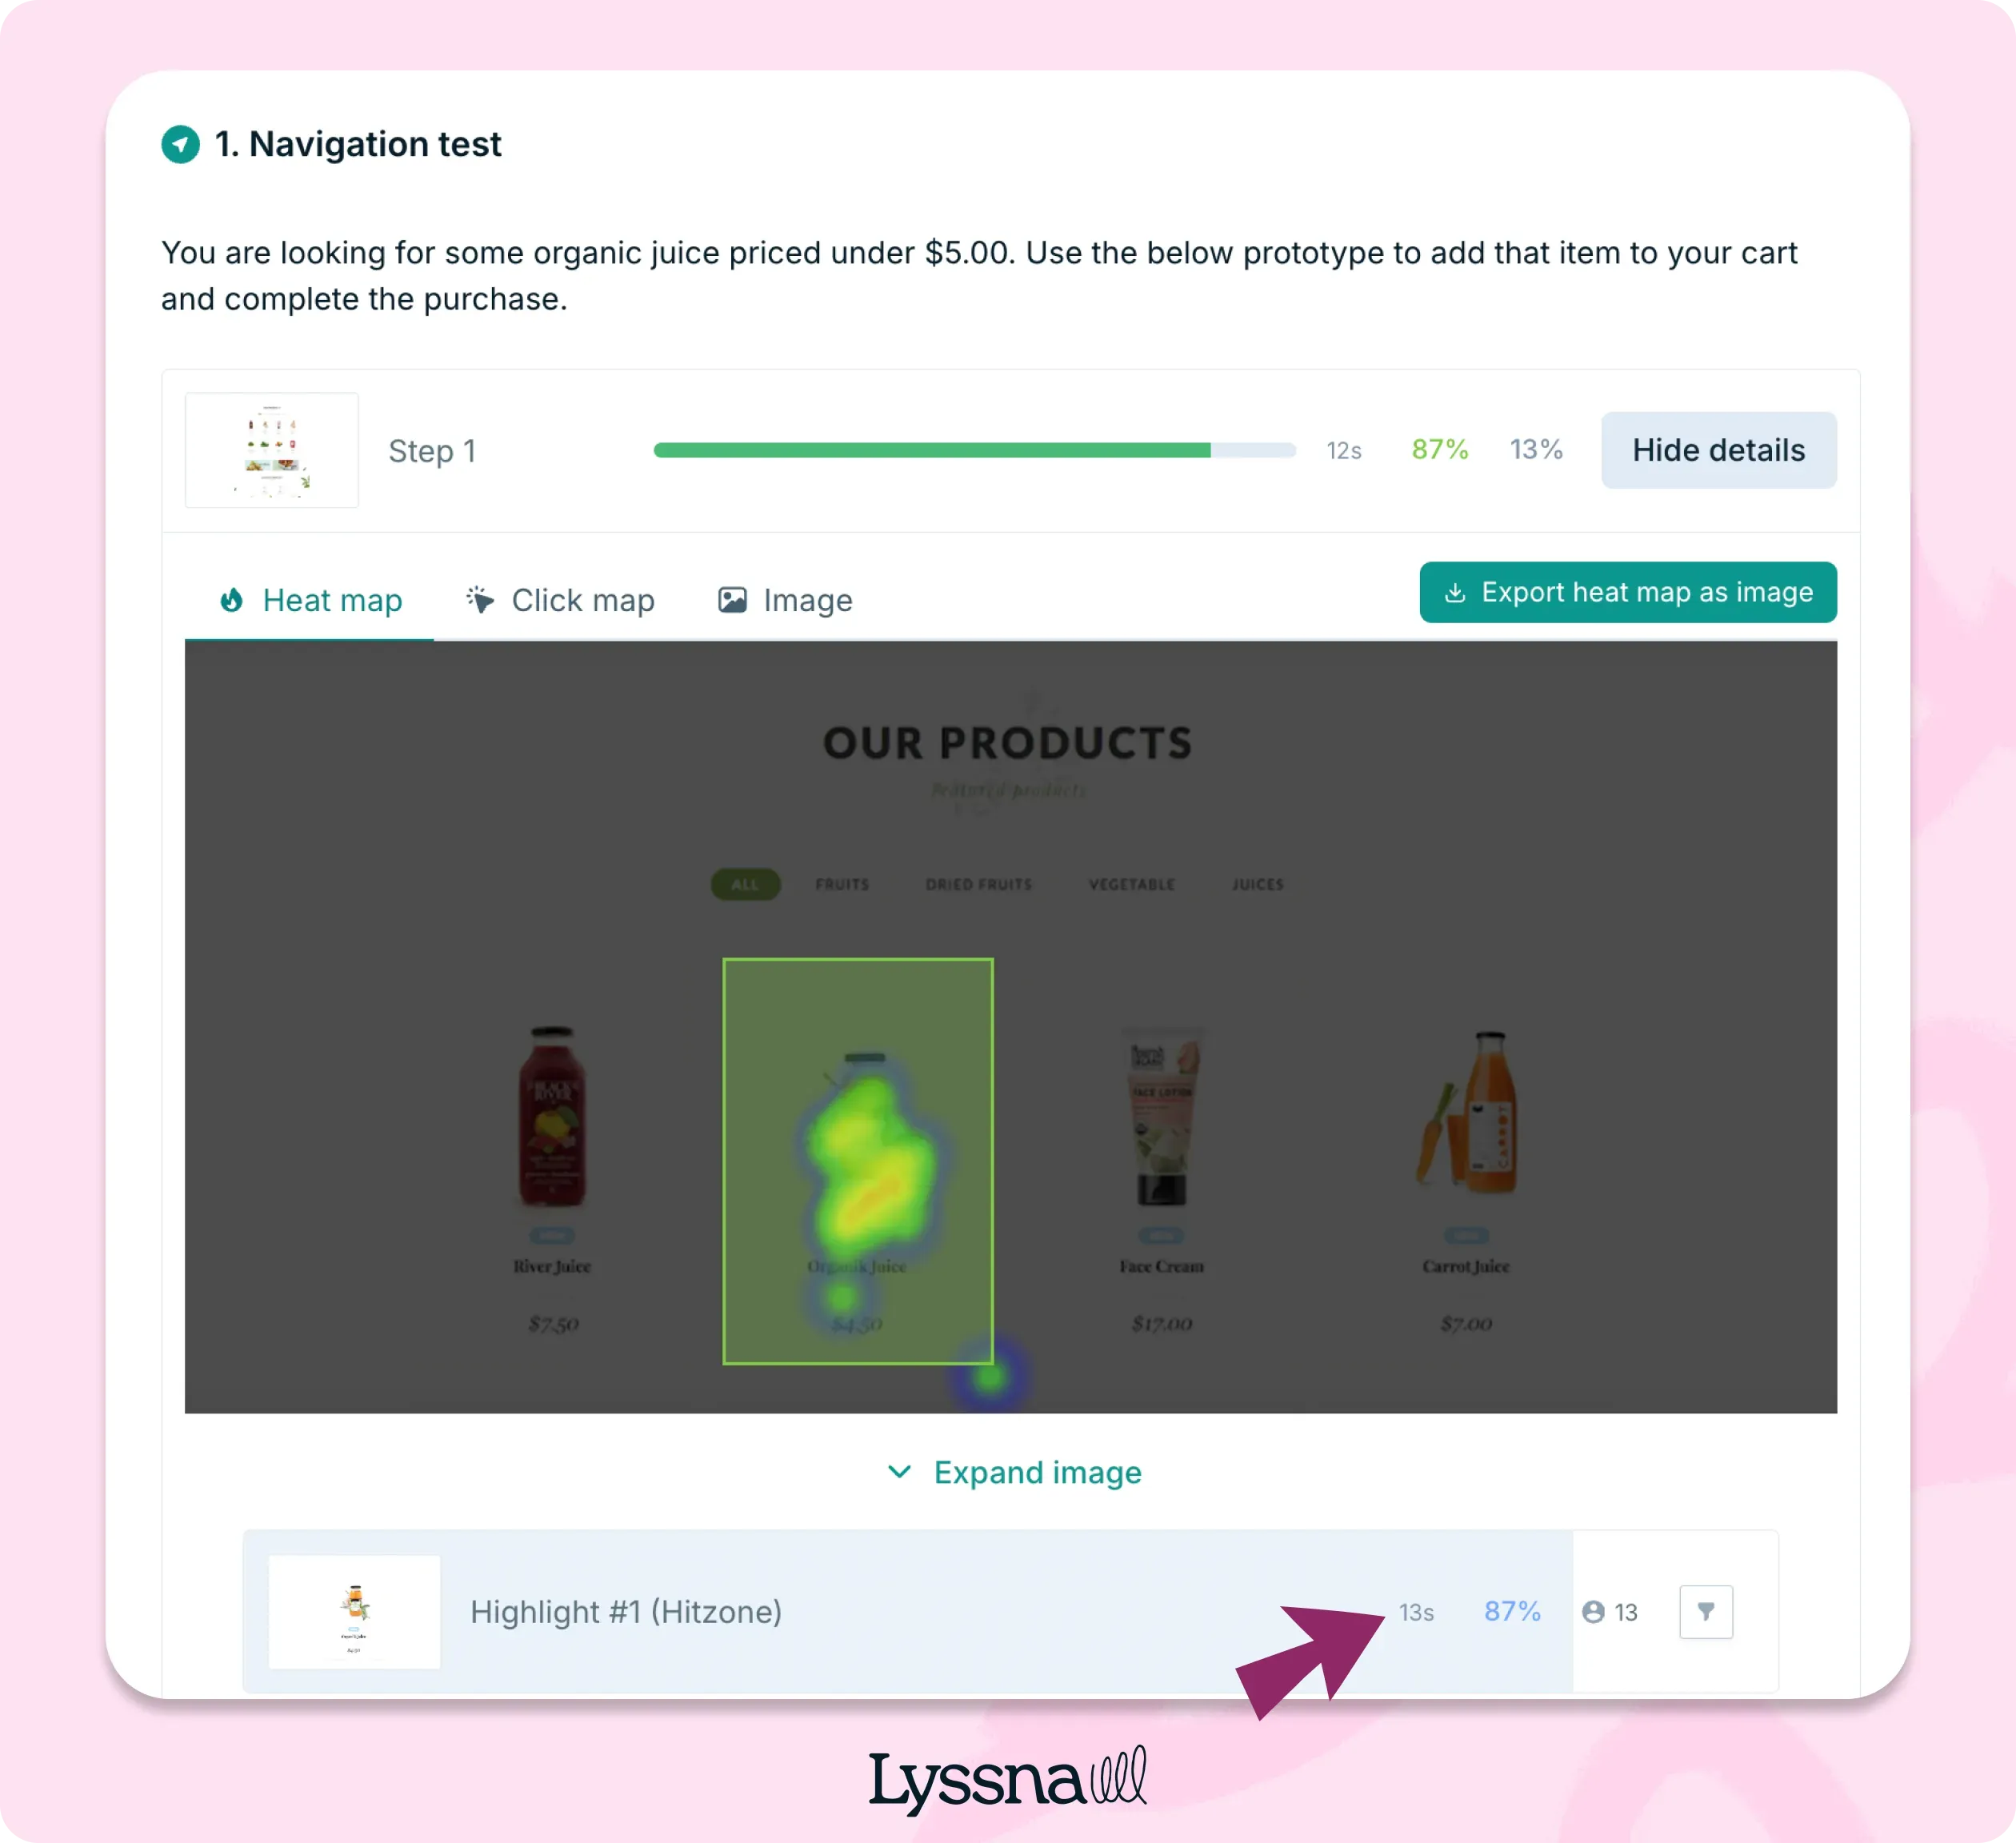
The task time displayed for a first click test in Lyssna
4. Learnability
Learnability is an efficiency metric that assesses how quickly users can perform a task accurately after they've had prior experience with the product. It's measured by comparing task times across different iterations or repetitions.
In a piece of workplace software, for example, a complex task may take 30 minutes on a user’s first time, but with repetition, they may get that down to 10 minutes. This can be visualized on a line graph showing the task time going down with each repetition.
5. Time on page
Time on page is an efficiency metric that calculates the total time users spend on a specific screen or page during their interaction with the product. It can reveal potential areas of interest or confusion for further investigation.
It’s calculated using the same formula as time on task: simply measure the amount of time the user is on that screen. You can also subtract their start time (on that page) from the completion time (of looking at that page).
6. Task level satisfaction
Task-level satisfaction gathers feedback on users' satisfaction with completing individual tasks. These questions are presented to the user immediately after they’ve completed the task and can take a number of forms, including Likert scales or smiley faces.
One popular format for gauging task-level satisfaction is the SEQ (Single Ease Question), which takes the following form:
Overall, how difficult or easy was the task to complete? Use the seven-point rating scale format below.
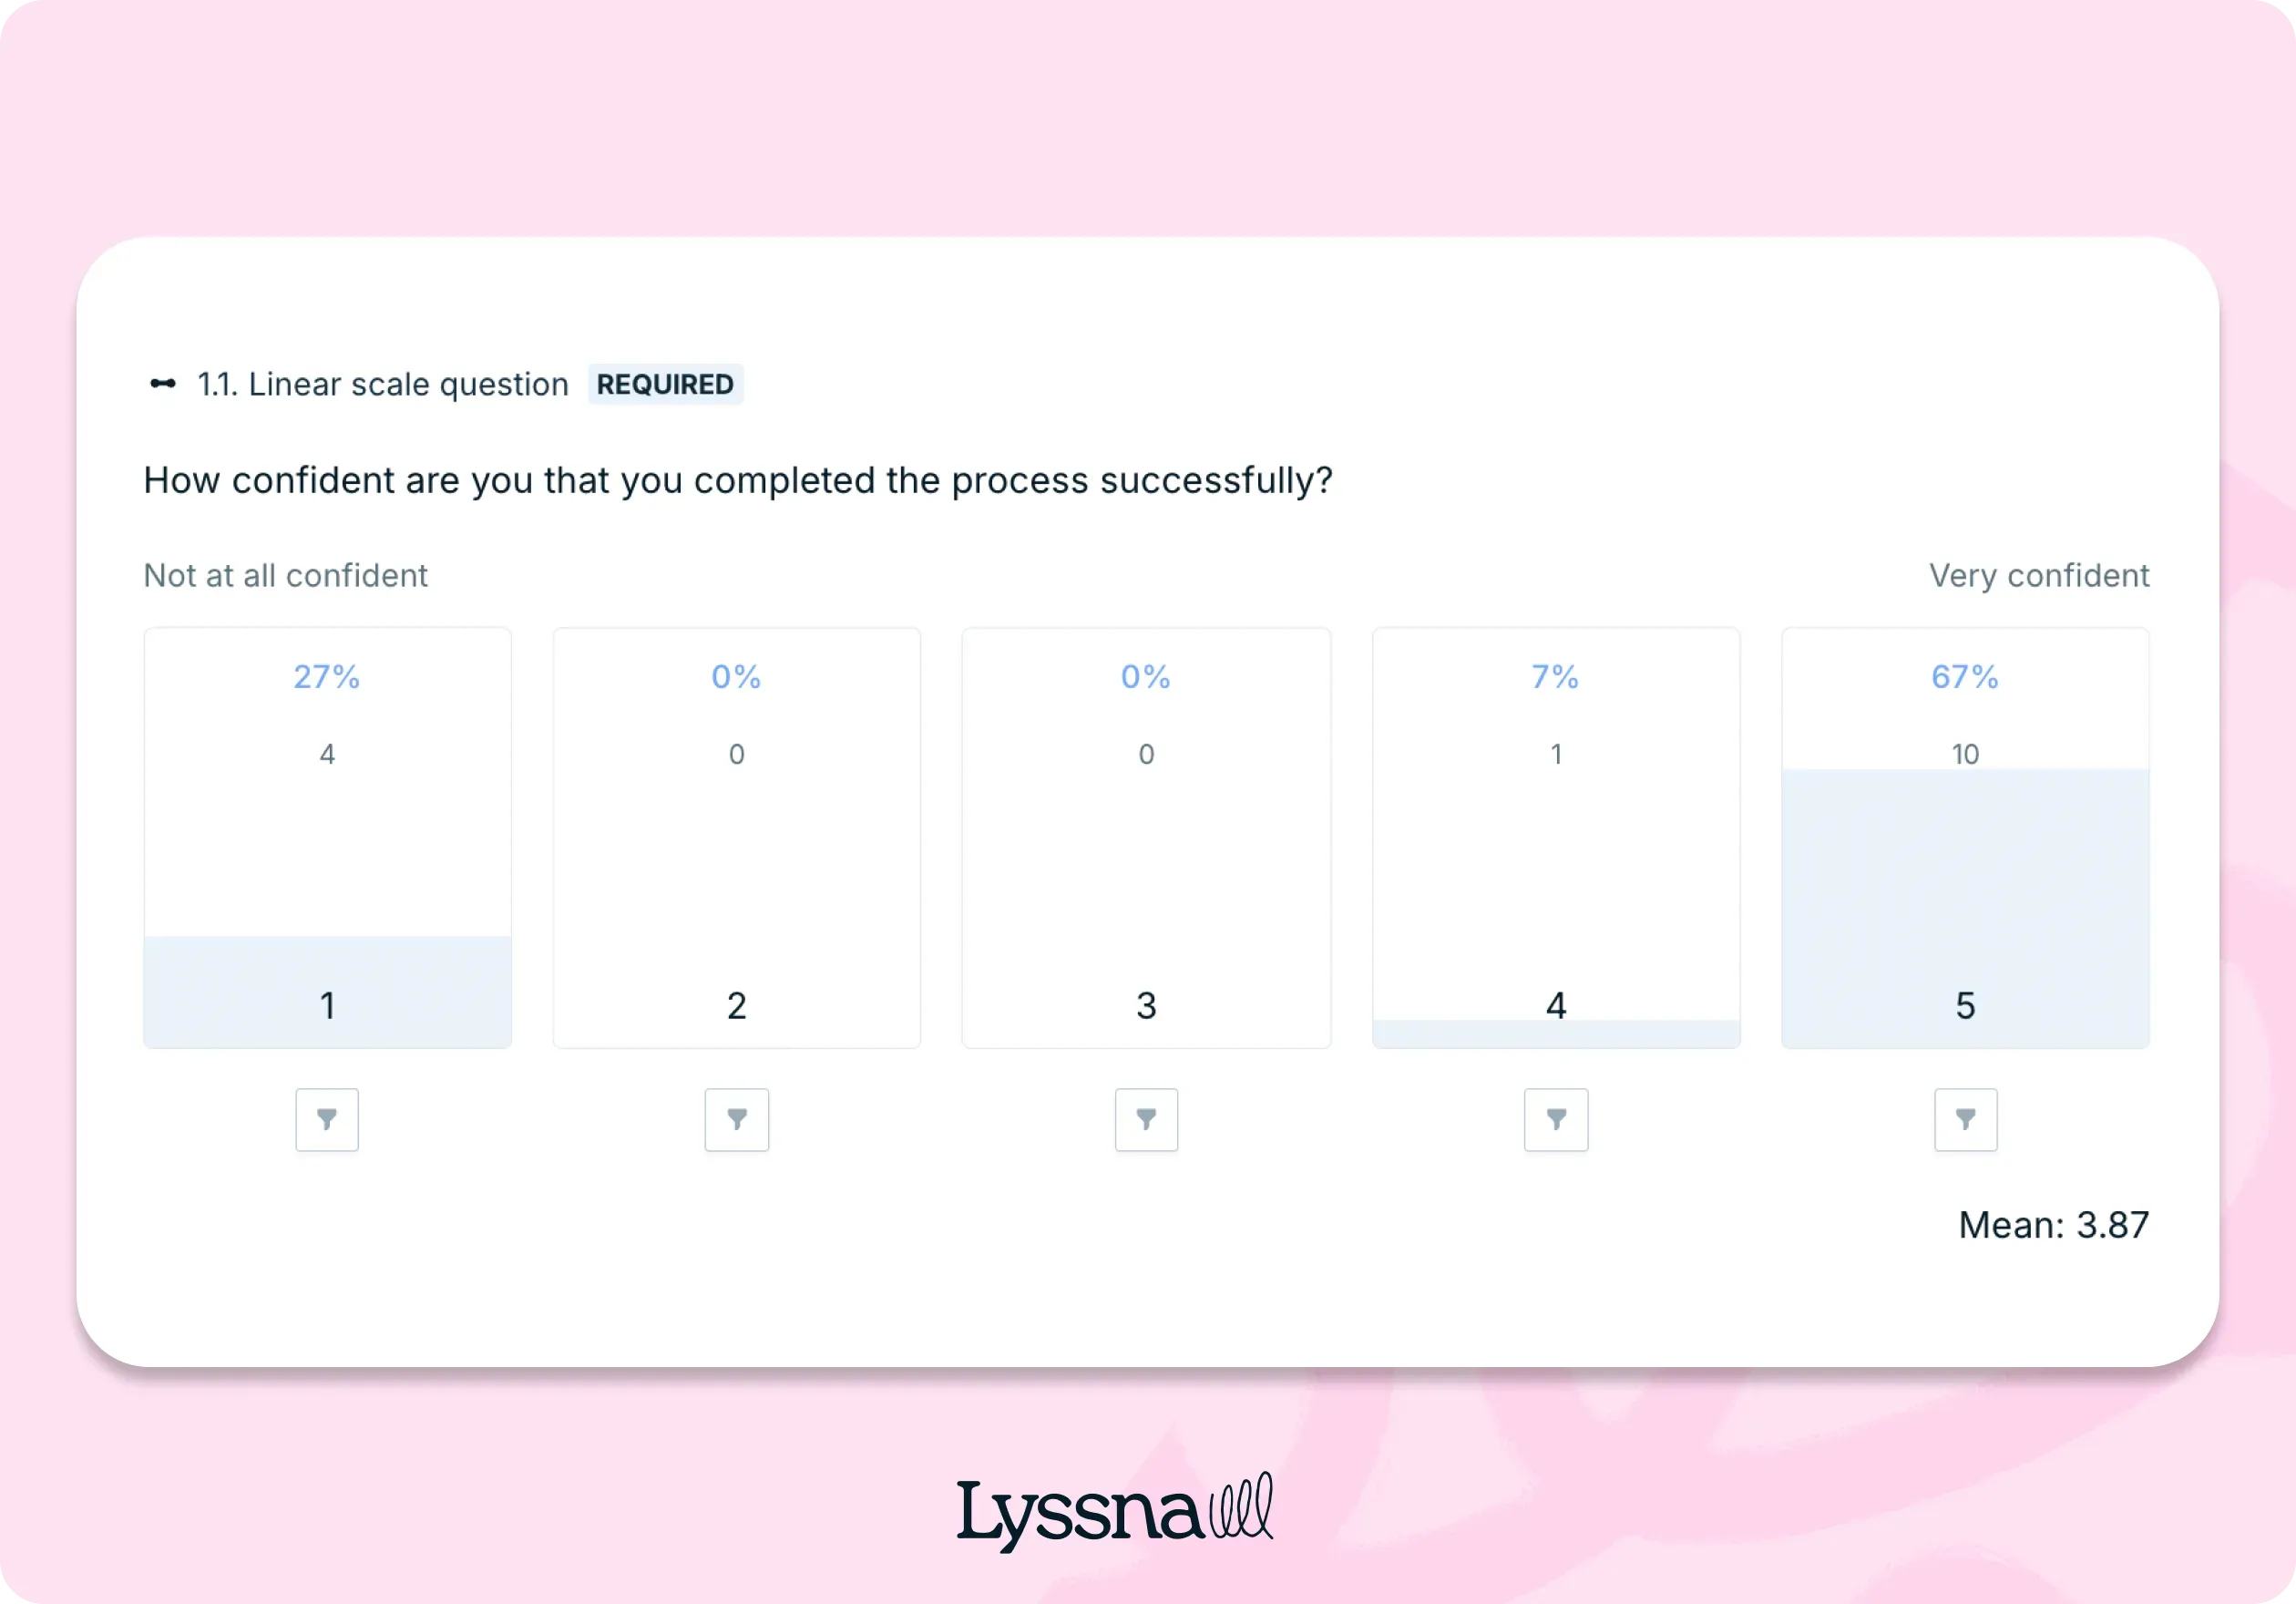
You could also consider NASA’s Task Load Index, which asks five questions to determine the mental effort a given task requires.
7. Test level satisfaction
Test-level satisfaction questions are more general and collect feedback on users' overall satisfaction with the entire testing experience or the product as a whole. They should be delivered at the end of a usability test. One popular format is the System Usability Scale (SUS), which consists of ten statements that users rate on a 5-point Likert scale.
Users rate their agreement with ten statements, such as:
I think I'd like to use this system frequently.
I found the system unnecessarily complex.
Other tests to consider include:
Standardized User Experience Percentile Rank Questionnaire (SUPR-Q)
Questionnaire For User Interaction Satisfaction (QUIS)
Software Usability Measurement Inventory (SUMI)
Tests like these provide a standardized and reliable measure of overall user satisfaction with a system or product.
Discover your digital product's usability with our System Usability Scale (SUS) template!
Streamline usability testing with Lyssna
Lyssna provides a suite of tools for recruiting representative users, performing tests, and generating rich usability metrics. Get started today and sign up for a free plan and see how easy it is to get valuable insights from your users.
Elevate your research practice
Join over 320,000+ marketers, designers, researchers, and product leaders who use Lyssna to make data-driven decisions.
Frequently asked questions about usability metrics
You may also like these articles


Try for free today
Join over 320,000+ marketers, designers, researchers, and product leaders who use Lyssna to make data-driven decisions.
No credit card required


