01 Sep 2025
|13 min
Tree testing vs card sorting
Explore the fundamentals of tree testing and card sorting in UX research. Discover their definitions, methodologies, and the strategic benefits they offer in enhancing user experience.


Did you know that poor website navigation causes users to abandon a site within just 10–20 seconds? When users can't find what they're looking for quickly, they simply leave. This is where information architecture (IA) research becomes critical to your product's success.
Two research methods stand out as essential tools for creating intuitive navigation: tree testing and card sorting. While both help you understand how users interact with your content organization, they serve distinctly different purposes and provide complementary insights.
This comprehensive guide explains what each method is, when to use them, and how to implement them effectively to create user-centered information architectures that actually work.
Key takeaways
Card sorting is generative – it helps you discover how users naturally organize content and reveals their mental models for information grouping.
Tree testing is evaluative – it validates whether your navigation structure actually works by measuring findability and success rates.
Use them sequentially – start with card sorting to understand user expectations, then use tree testing to validate that your structure achieves 75%+ success rates.
Start testing today
Ready to optimize your navigation? Try Lyssna's card sorting and tree testing tools – set up your first study in minutes.

What is tree testing?
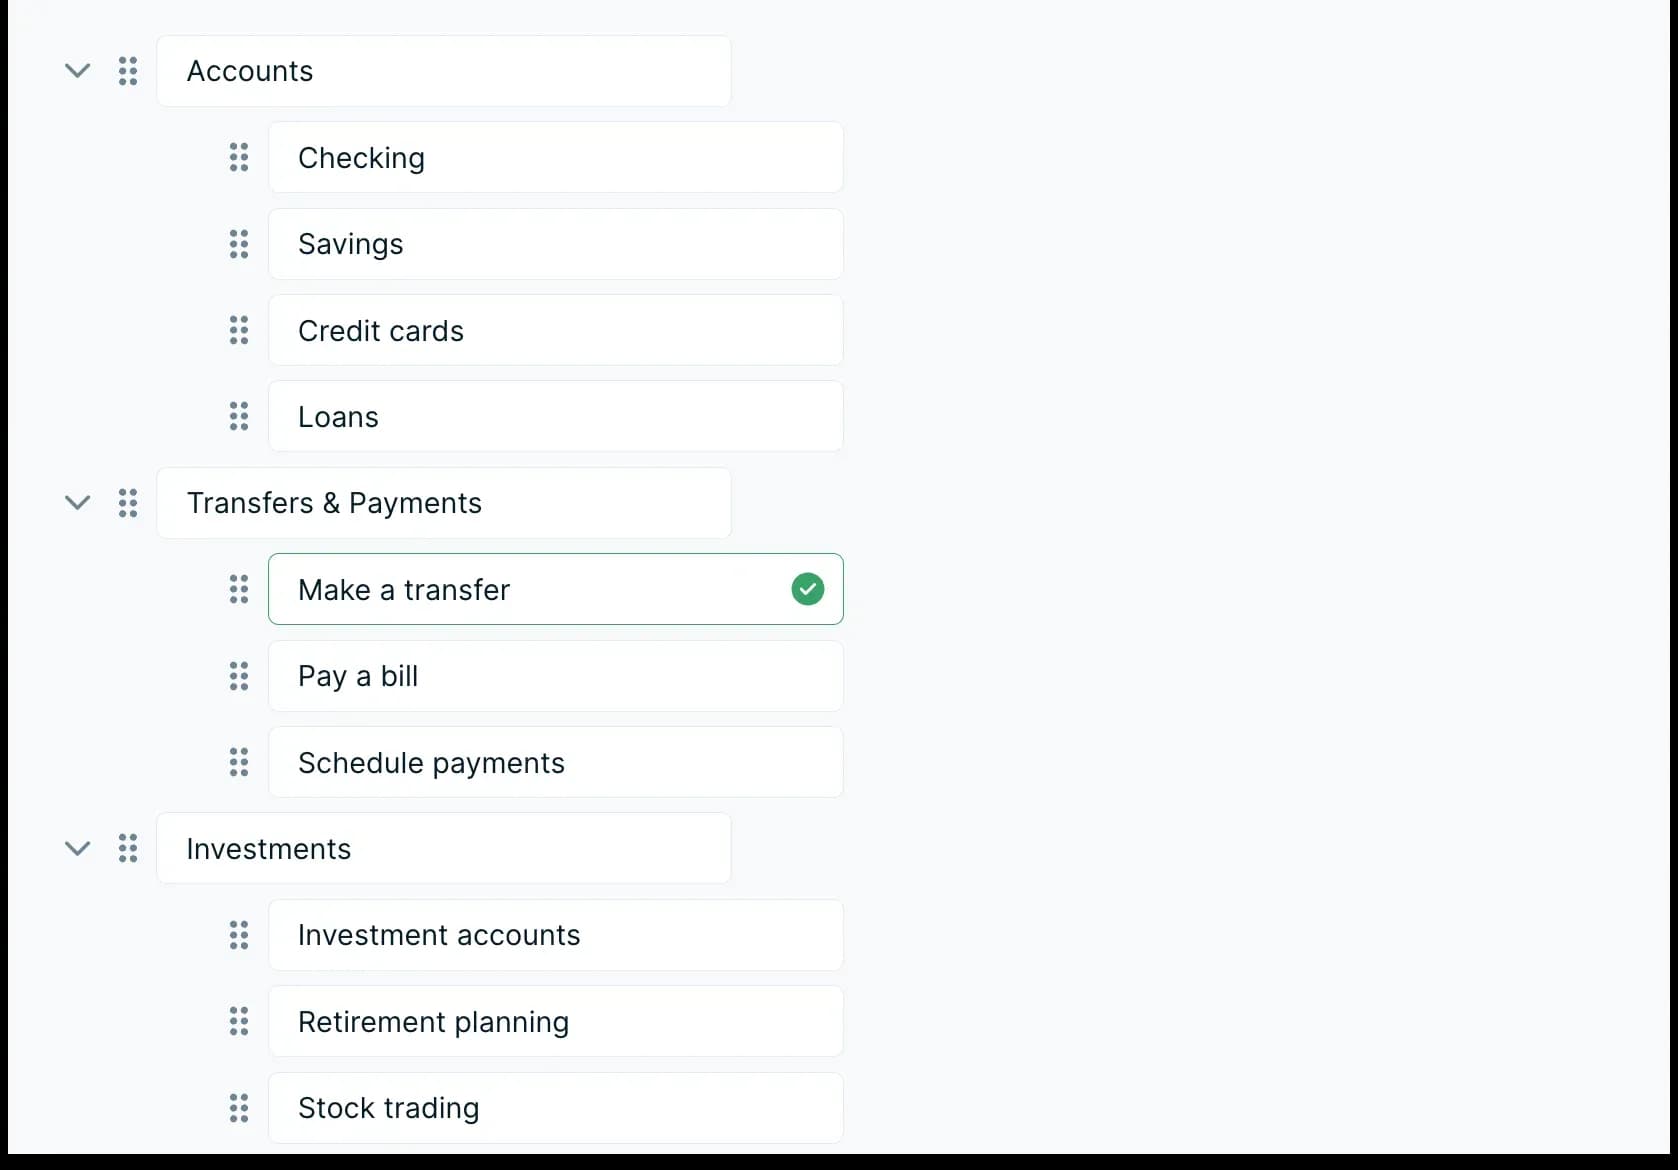
Tree testing evaluates how easily people can find information in a website or app structure. It's sometimes called "reverse card sorting" because instead of organizing content, participants try to locate it.
In a tree test, participants see a text-only version of a site's navigation structure (the "tree") – just the labels and hierarchy without any design elements. You give them tasks like "Where would you find information about pricing?" and they must navigate through the structure to find the answer.
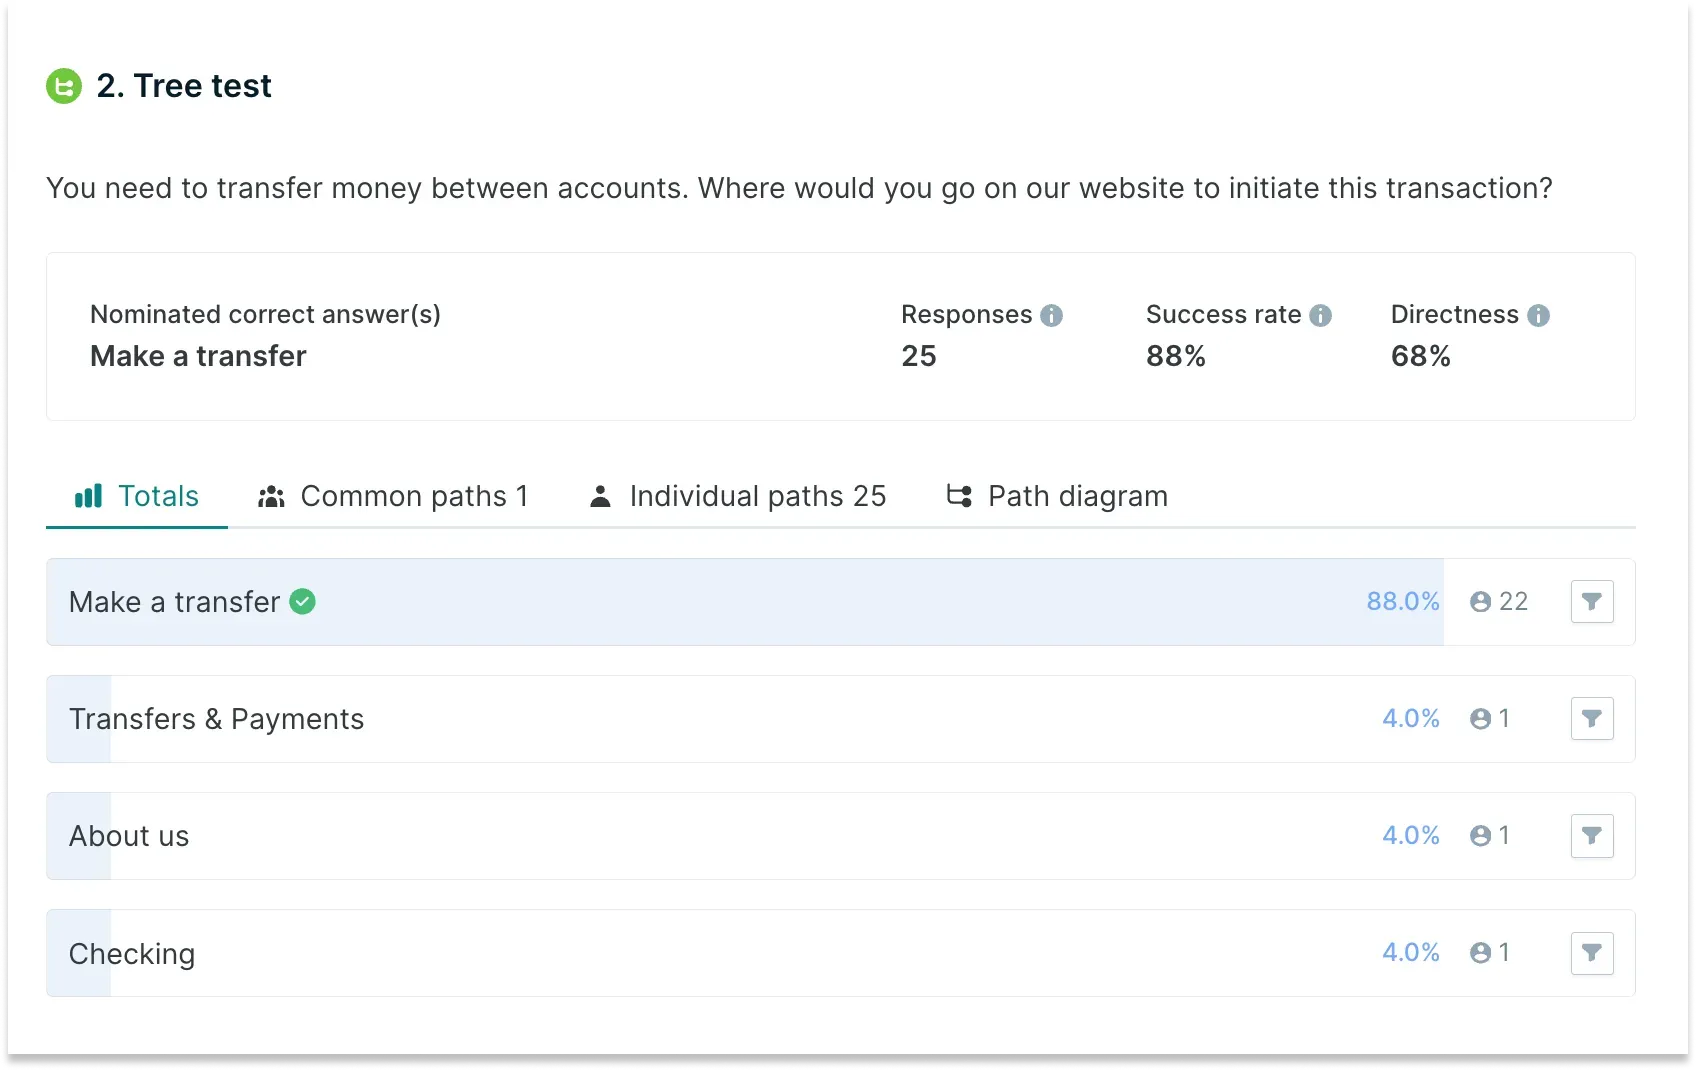
What tree testing measures
Tree testing evaluates three key aspects:
Findability: Can users successfully locate specific information?
Navigation structure: Does the organization of content make sense?
Label clarity: Are category names clear and meaningful?
Tree testing performance benchmarks
You can use the below table as a guide when analyzing your tree testing results:
Success Rate | Performance Level | Action Required |
|---|---|---|
90%+ | Excellent | Minor optimization only |
80-90% | Very Good | Small improvements |
61-80% | Good | Moderate improvements needed |
Below 61% | Needs Improvement | Significant restructuring required |
Additional key metrics:
Target directness rate: Aim for 75%+ for good navigational clarity.
Average completion time: Successful tasks should complete within 2–3 minutes.
First click success: Strong correlation with overall task success.
Important context for tree testing results
It's important to understand that tree testing results will always be lower than your final website performance.
This happens because:
Tree tests lack visual design elements that aid navigation.
No search functionality is available.
Context clues like images and descriptions are missing.
However, this makes tree testing incredibly valuable – if your navigation works in a text-only environment, it will work even better with full design elements.
What is card sorting?
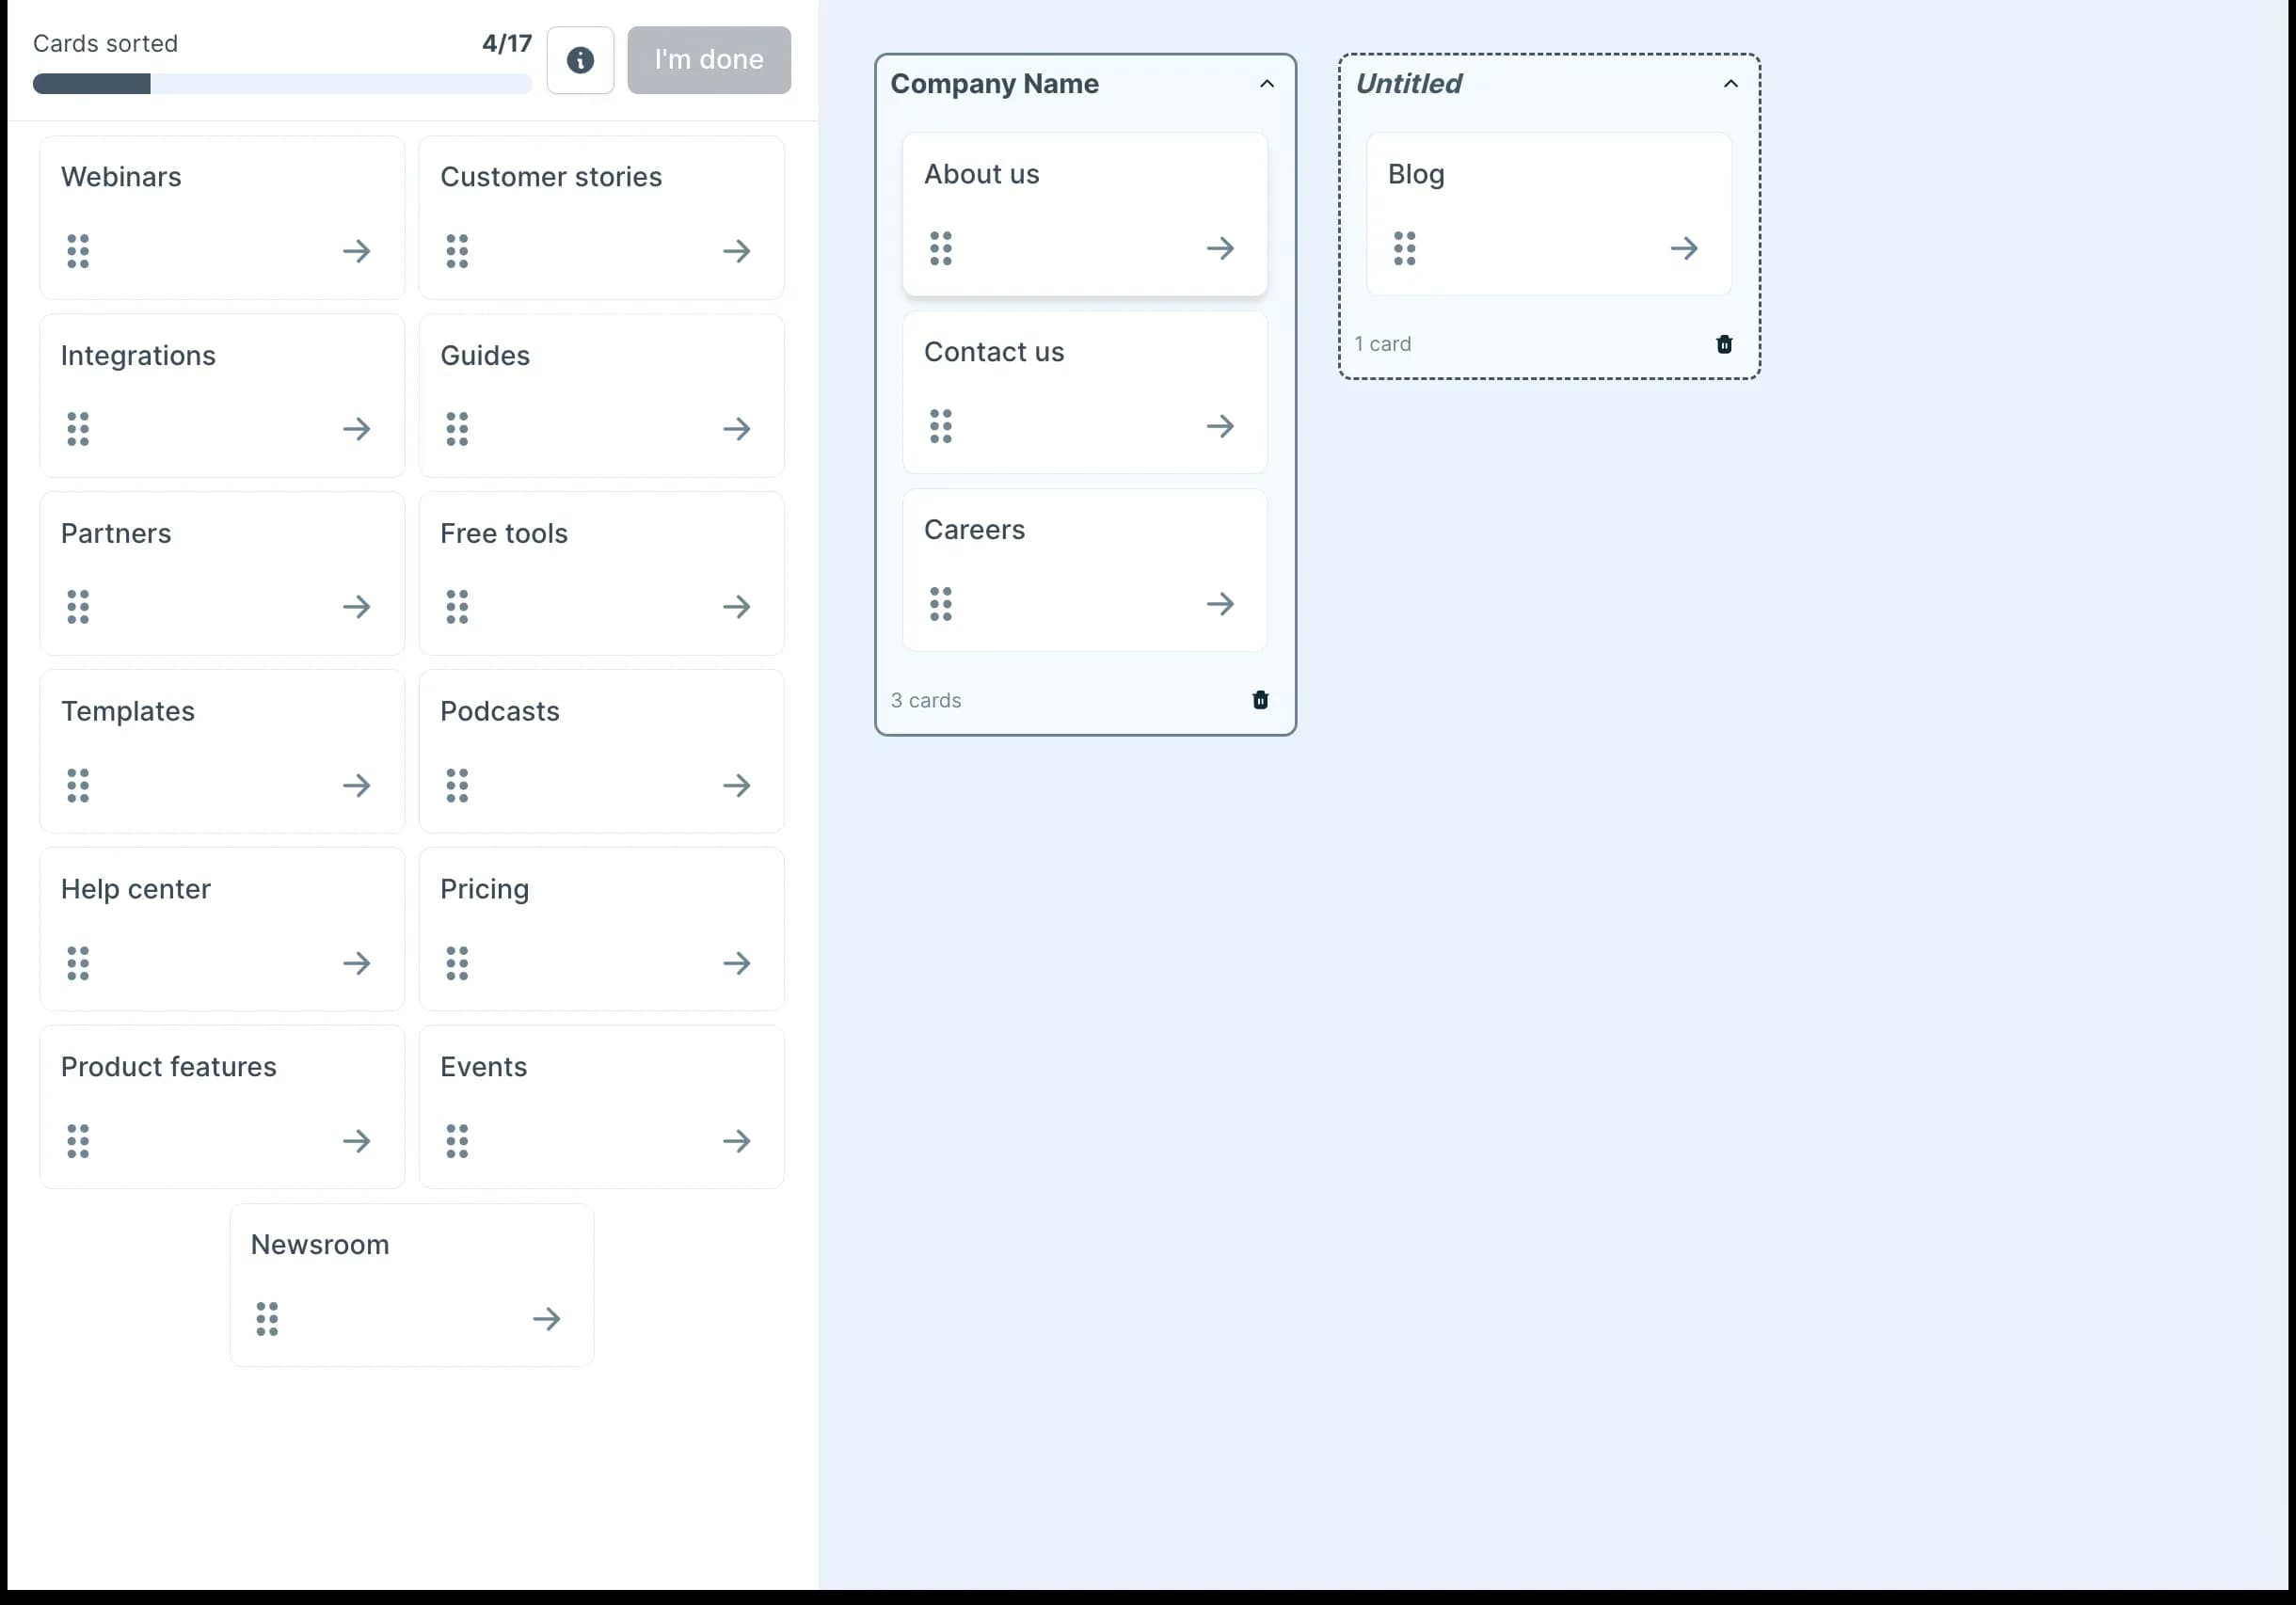
Card sorting is a research method where participants organize content items into groups that make sense to them. Each "card" represents a piece of content, like a product feature, article topic, or website section.
During a card sorting session, you ask participants to look at each card and place it into a category. These groupings reflect how users naturally think about and organize information.
Card sorting helps you understand the mental models of your users – how they expect information to be structured. This is valuable when designing navigation systems, menus, and content hierarchies.
Types of card sorting
There are three main types of card sorting:
Open card sorting: Participants create and name their own categories.
Closed card sorting: Participants sort items into predefined categories.
Hybrid card sorting: Combines elements of both approaches.
Research-backed best practices for card sorting
Sample size recommendations:
Quantitative studies: 20–30 participants for statistically reliable patterns (based on a study by Tullis & Wood).
Qualitative insights: 15–20 participants minimum for identifying key themes (Nielsen Norman Group).
Timing and setup guidelines:
Average session duration: 15-30 minutes.
Optimal card count: 30–60 items to prevent participant fatigue.
Card fatigue threshold: 60+ cards significantly increases completion time and reduces data quality.
Real-world application: monday.com's approach
monday.com, a global work management platform serving customers in over 200 countries, demonstrates the practical power of card sorting. Nadav Hachamov, UX Researcher at monday.com, explains that the team employed a card sort test to gauge user sentiment and effectively name a new feature.
Customers from the UK, US, and Australia had to categorize potential banner headlines into three sections: 'I understand & not appealing,' 'I understand & This is appealing,' and 'I don't understand.'
This example shows how card sorting can validate not just information architecture, but also content strategy and feature naming – ensuring that new features resonate with users across different markets.

Tree testing vs card sorting
While both methods focus on information architecture, tree testing and card sorting serve different purposes and produce different types of insights.
Comprehensive comparison
Aspect | Card Sorting | Tree Testing |
|---|---|---|
Purpose | Discover how users organize content | Evaluate how well users can find content |
When to use | Early in the design process | After a draft structure exists |
What it tests | User mental models and category preferences | Navigation effectiveness and findability |
Process | Users group and label content | Users find items in a text hierarchy |
Sample Size | 20–30 (quantitative), 15–20 (qualitative) | 15–50 participants depending on statistical requirements |
Average Duration | 15–30 minutes | 10–20 minutes |
Analysis Complexity | High (qualitative interpretation required) | Medium (clear quantitative metrics) |
Participant Fatigue | High with 60+ cards | Low (task-focused) |
Success Metrics | Category agreement %, grouping patterns | Success rate %, directness %, time-on-task |
Output | Category groupings and naming patterns | Success rates, navigation paths, time-on-task |
When to use each method
Use card sorting when:
You're designing a new website or app.
You're reorganizing existing content.
You want to understand how users group information.
You need ideas for category names and content groupings.
Use tree testing when:
You have a draft information architecture to evaluate.
You want to validate navigation before implementation.
You need to identify where users get lost in your structure.
You're comparing different navigation approaches.

How to use card sorting and tree testing together
The most effective approach combines both methods in a strategic sequence:
Discovery (card sorting)
Start with card sorting to understand how users naturally organize content.
Conduct open card sort with 20+ participants for reliable patterns.
Analyze grouping patterns and category preferences.
Identify mental model insights and terminology preferences.
Structure creation
Create a draft structure based on card sorting insights.
Incorporate user groupings and preferred terminology.
Balance user preferences with business requirements.
Develop clear, descriptive category labels.
Validation (tree testing)
Use tree testing to validate the draft structure.
Test with 15–20 participants for statistical reliability.
Measure success rates, directness, and identify problem areas.
Target 75%+ success rates for critical navigation paths.
Iteration
Refine and retest based on tree testing results.
Make targeted changes to low-performing areas.
Run focused tree tests on problem categories.
Continue until achieving target success rates.
This combination provides both generative insights (how to organize) and evaluative feedback (how well it works).

Tree testing and card sorting templates
Ready to start testing your information architecture? The best way to apply card sorting and tree testing is with scenarios designed around real user goals.
Here are some pre-designed tree testing and card sorting templates to help you get started – just modify them to suit your needs:
Master the complete card sorting and tree testing workflow
Want to see these methods in action? Our workshop "Design better navigation using card sorting and tree testing" demonstrates the exact process outlined in this guide.
Watch as we walk through real examples of the discovery-to-validation workflow, showing you how to analyze card sorting results, create effective tree structures, and interpret tree testing data.
Best tree testing and card sorting tools
Selecting the right tool significantly impacts your research quality and efficiency. Here's how leading platforms compare:
Platform | Best For | Pricing | Key Strengths | Limitations |
|---|---|---|---|---|
Lyssna | Mid-size teams, comprehensive IA research | Starting at $165/month for the Growth plan | Both methods + 690K+ participant panel + 55 languages | Card sorting and tree testing is only available on Lyssna |
Optimal Workshop | Established IA teams | $199/month Starter plan | Industry standard, advanced cluster analysis | Steeper learning curve, higher cost |
UserZoom | Enterprise organizations | Pricing unavailable | Comprehensive research platform | Very high cost, complex interface |
UXtweak | Small teams, budget-conscious | €92/month Business plan Free plan available | Good analytics, affordable | Smaller participant pool |
Maze | Design teams, rapid iteration | Card sorting and tree testing included on the Enterprise plan | Strong design tool integration | Limited IA-specific features |
Why teams choose Lyssna
Lyssna provides the most comprehensive solution for information architecture research:
Complete methodology support: Both card sorting and tree testing in one platform.
Global participant access: 690,000+ participants across 100+ countries when recruiting from the Lyssna research panel.
Multilingual capabilities: Conduct research in 55 languages.
Cost efficiency: Affordable option that scales with your organization.
Ease of use: Set up studies in minutes, not hours.
As Nadav Hachamov from monday.com notes about their experience with Lyssna:
"The ability to test quickly with minimum steps and friction, plus the test reports are clear and helpful."

Card sorting and tree testing best practices
Card sorting setup and execution
Pre-study preparation:
Recruit representative users – use screener questions if you have specific participant requirements.
Create clear, jargon-free card labels that avoid biasing participants.
Limit to 30–60 cards to prevent fatigue.
During the study:
Provide clear, non-directive instructions.
Encourage participants to think aloud (in moderated or think-aloud recorded sessions).
Ask follow-up questions about grouping decisions, such as:
For moderated sessions: "Can you tell me why you put these cards together?" or "What made you hesitate about placing that card there?"
For unmoderated sessions: Include post-sort questions like "Please explain why you grouped these items together" or "Were there any cards that were difficult to categorize? Which ones and why?"
Note any cards that participants find difficult to categorize.
Analysis approach:
Look for patterns across participants, not a perfect consensus.
Focus on majority groupings (60%+ agreement indicates strong patterns).
Pay attention to category names participants create.
Identify outliers and understand why certain items are difficult to categorize.
Tree testing implementation
Structure creation:
Build your tree down to 3-4 levels maximum for manageable complexity.
Use clear, descriptive category labels that match user vocabulary.
Create a few realistic finding tasks based on actual user goals.
Define specific success criteria for each task.
Task design best practices:
Frame tasks as realistic scenarios users might encounter.
Avoid using words that appear in category labels (e.g. if you have a "Pricing" category, ask "Where would you find information about costs?" instead of "Where would you find pricing information?").
Vary task difficulty to test different navigation paths.
Include both shallow and deep navigation scenarios.
In our below video we share some best practices on creating realistic tasks and scenarios:
Follow-up questions for unmoderated studies:
Include post-task questions to gather qualitative insights:
"How confident are you that you found the correct answer?"
"If you had to guess, where else might you have looked for this information?"
"Were any of the category labels confusing or unclear?"
"Did you expect to find this information somewhere else in the navigation?"
Analysis framework:
Success rate analysis: Identify categories with <60% success for immediate attention.
Directness review: Flag tasks with <75% directness as inefficient paths.
First click analysis: Understand where users expect to find information.
Time analysis: Investigate tasks taking >3 minutes for potential issues.

Tree testing and card sorting common mistakes to avoid
Card sorting challenges
Challenge: Inconsistent grouping patterns across participants.
Solution: Increase sample size to 30+ participants and focus on majority patterns rather than seeking perfect consensus. Consider running follow-up card sorts to validate findings.
Challenge: Participant fatigue affecting result quality.
Solution: Break large card sets into focused sessions, use progressive disclosure, or conduct multiple shorter sessions with overlapping content.
Challenge: Difficulty interpreting conflicting groupings
Solution: Combine quantitative analysis with qualitative interviews to understand the reasoning behind different organizational approaches.

Tree testing challenges
Challenge: Low success rates across all tasks.
Solution: Review category labels for clarity and industry-standard terminology. Consider whether the tree structure is too deep or complex.
Challenge: High success but low directness scores.
Solution: Examine navigation paths for unnecessary complexity. Look for opportunities to reorganize or provide multiple pathways to important content.
Challenge: Inconsistent first-click patterns.
Solution: This often indicates unclear category labels or overlapping categories. Consider restructuring or renaming categories to be more distinct.

Building user-centric information architecture
Information architecture forms the foundation of good user experience. When content is organized in a way that matches how users think, people can find what they need quickly and easily.
Card sorting and tree testing are complementary methods that help create user-centered information architectures:
Card sorting reveals how users think about your content and what organizational structures make sense to them.
Tree testing validates whether those structures actually work when users need to find specific information.
By using both methods as part of your design process, you can create navigation systems and content hierarchies that truly work for your users.
As monday.com's approach demonstrates, this continuous testing mindset – enabled by tools like Lyssna – leads to enhanced and customer-centric experiences for users worldwide.
FAQs about tree testing vs card sorting
You may also like these articles


Try for free today
Join over 320,000+ marketers, designers, researchers, and product leaders who use Lyssna to make data-driven decisions.
No credit card required