09 Jul 2024
|18 min
Data-driven design
Learn how to enhance your design process with data-driven strategies.


Hands up if you've ever designed something and thought, "This looks awesome! It'll totally work!", only to have that little voice in the back of your head whisper, "But does it actually work?".
We get it. It's easy to get caught up in the creative rush and prioritize what looks good over backing it up with research and data. But relying solely on your gut feeling and what looks good can only take you so far. For some teams, design is often driven by what stakeholders want. This can lead to decisions based on personal preferences or assumptions about what users need, rather than actual evidence. Take it from Ron Dorio, VP of Business Development & Innovation at The Economist Group (TEG).
“Design is very much driven by internal discussions, however these could often happen in isolation from end-users.”
If you and your team want to create impactful products and services that resonate with users, it's high time that you embrace a data-driven approach.
But where do you even begin if you're new to this whole user research and data thing?
This guide to data-driven design is for you.
Elevate your research practice
Join over 320,000+ marketers, designers, researchers, and product leaders who use Lyssna to make data-driven decisions.

Data-driven design definition
Data-driven design is the practice of using data to guide your design decisions. Data can either be quantitative (numbers, measurements, and facts) or qualitative (user perspectives and experiences, often reported in their own words).
It's worth noting that data-driven design is more than just numbers and insights. It's about understanding the motivations and reasons (the why) behind the data.
Julie Zhuo, former VP Product Design at Facebook and author of The Making of a Manager, beautifully describes the paradoxical relationship between data and design:
"Data is the contextual stage, the lessons learned, the structured hypotheses. Design is the sword of action, the next experiment, the possible futures.
We diagnose with data. We treat with design."
For example, let's say you’re trying to improve retention rates for a fitness app. Your data may reveal that a significant number of users abandon their workout routines after a few weeks. Meanwhile, you find out during user interviews that users feel demotivated by the lack of personalized feedback. Armed with this knowledge, you could redesign the app to include features like personalized progress tracking and motivational messages, which could help boost user engagement and retention.
"In the deep heart of data and design burns the same flame: the search for the truth of a phenomenon,” describes Zhuo.
Benefits of data-driven design
Whether you're a seasoned designer or just starting out in your UX design career path, a data-driven approach to design can transform your products, users' experiences, and even stakeholder relationships.
Here are some of the upsides of data-driven design with real-world examples from the Economist Group (TEG), a premier media company with a long history in publishing that stems from their flagship title, The Economist. TEG used Lyssna for their data-driven approach to design decisions.
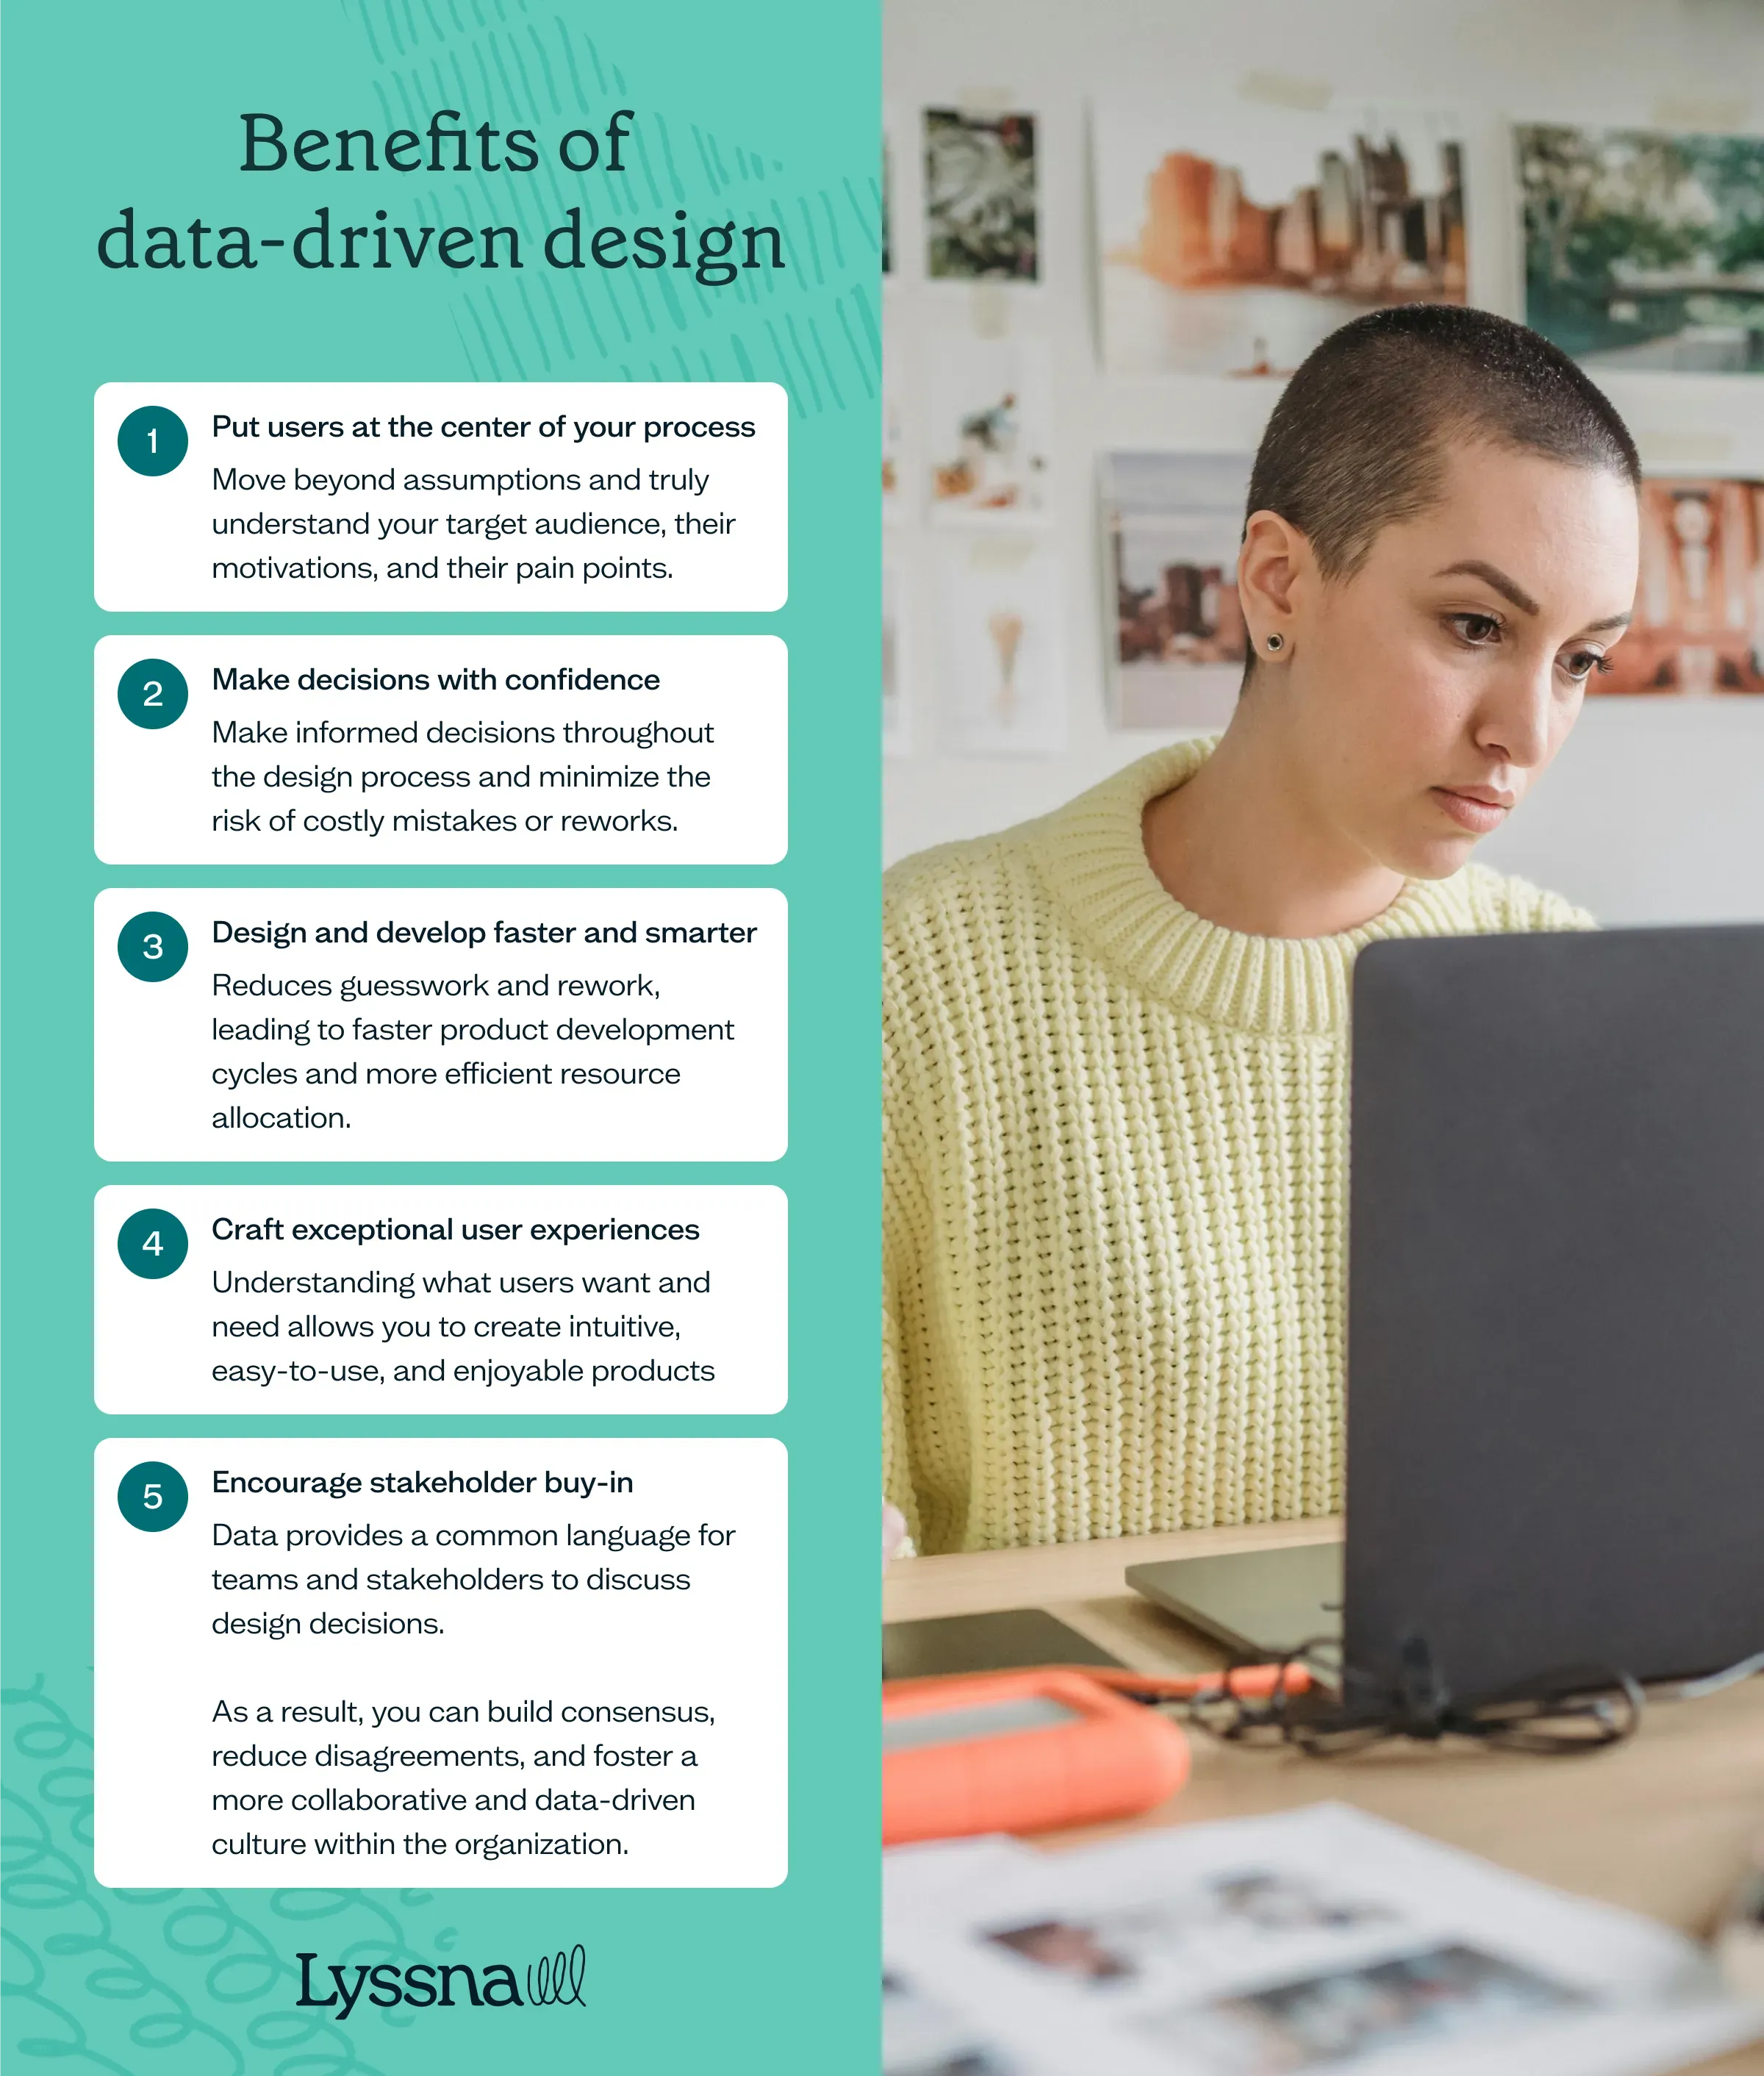
1. Put users at the center of your process
Even the best designers can't always predict what users want or need. Data-driven design helps you move beyond assumptions and truly understand your target audience, their motivations, and their pain points.
As an example, TEG used Lyssna to test different design aesthetics and optimize landing pages, ensuring their choices resonated with their target audience in emerging markets, even though they had no prior experience in those markets. "Adopting Lyssna got us into the habit of asking our users questions before locking in decisions," shares Dorio.
2. Make decisions with confidence
Data provides crucial insights into user behavior, preferences, and pain points. Consequently, you can make informed decisions throughout the design process and minimize the risk of costly mistakes or reworks.
By testing small design pieces before launch, TEG avoided potential design pitfalls and made sure contentious choices were based on user data, not just internal opinions.
3. Design and develop faster and smarter
Data-driven design reduces guesswork and rework, leading to faster product development cycles and more efficient resource allocation. Teams can quickly validate ideas, prioritize features, and focus on evidence-based solutions.
For example, TEG discovered that they could set up tests and get data in minutes, reducing the need for lengthy discussions and debates based on assumptions.
4. Craft exceptional user experiences
Understanding what users want and need allows you to create intuitive, easy-to-use, and enjoyable products. This, in turn, leads to higher user engagement, satisfaction, and loyalty, ultimately driving product success.
TEG made sure that their websites and components were attractive and functional by gathering feedback early in the design process. This delivered a positive user experience right from the start.
5. Encourage stakeholder buy-in
Data provides a common language for teams and stakeholders to discuss design decisions. As a result, you can build consensus, reduce disagreements, and foster a more collaborative and data-driven culture within the organization.
TEG also saw increased stakeholder buy-in and fewer disagreements during meetings due to the use of data to validate design choices.
Types of data and data sources
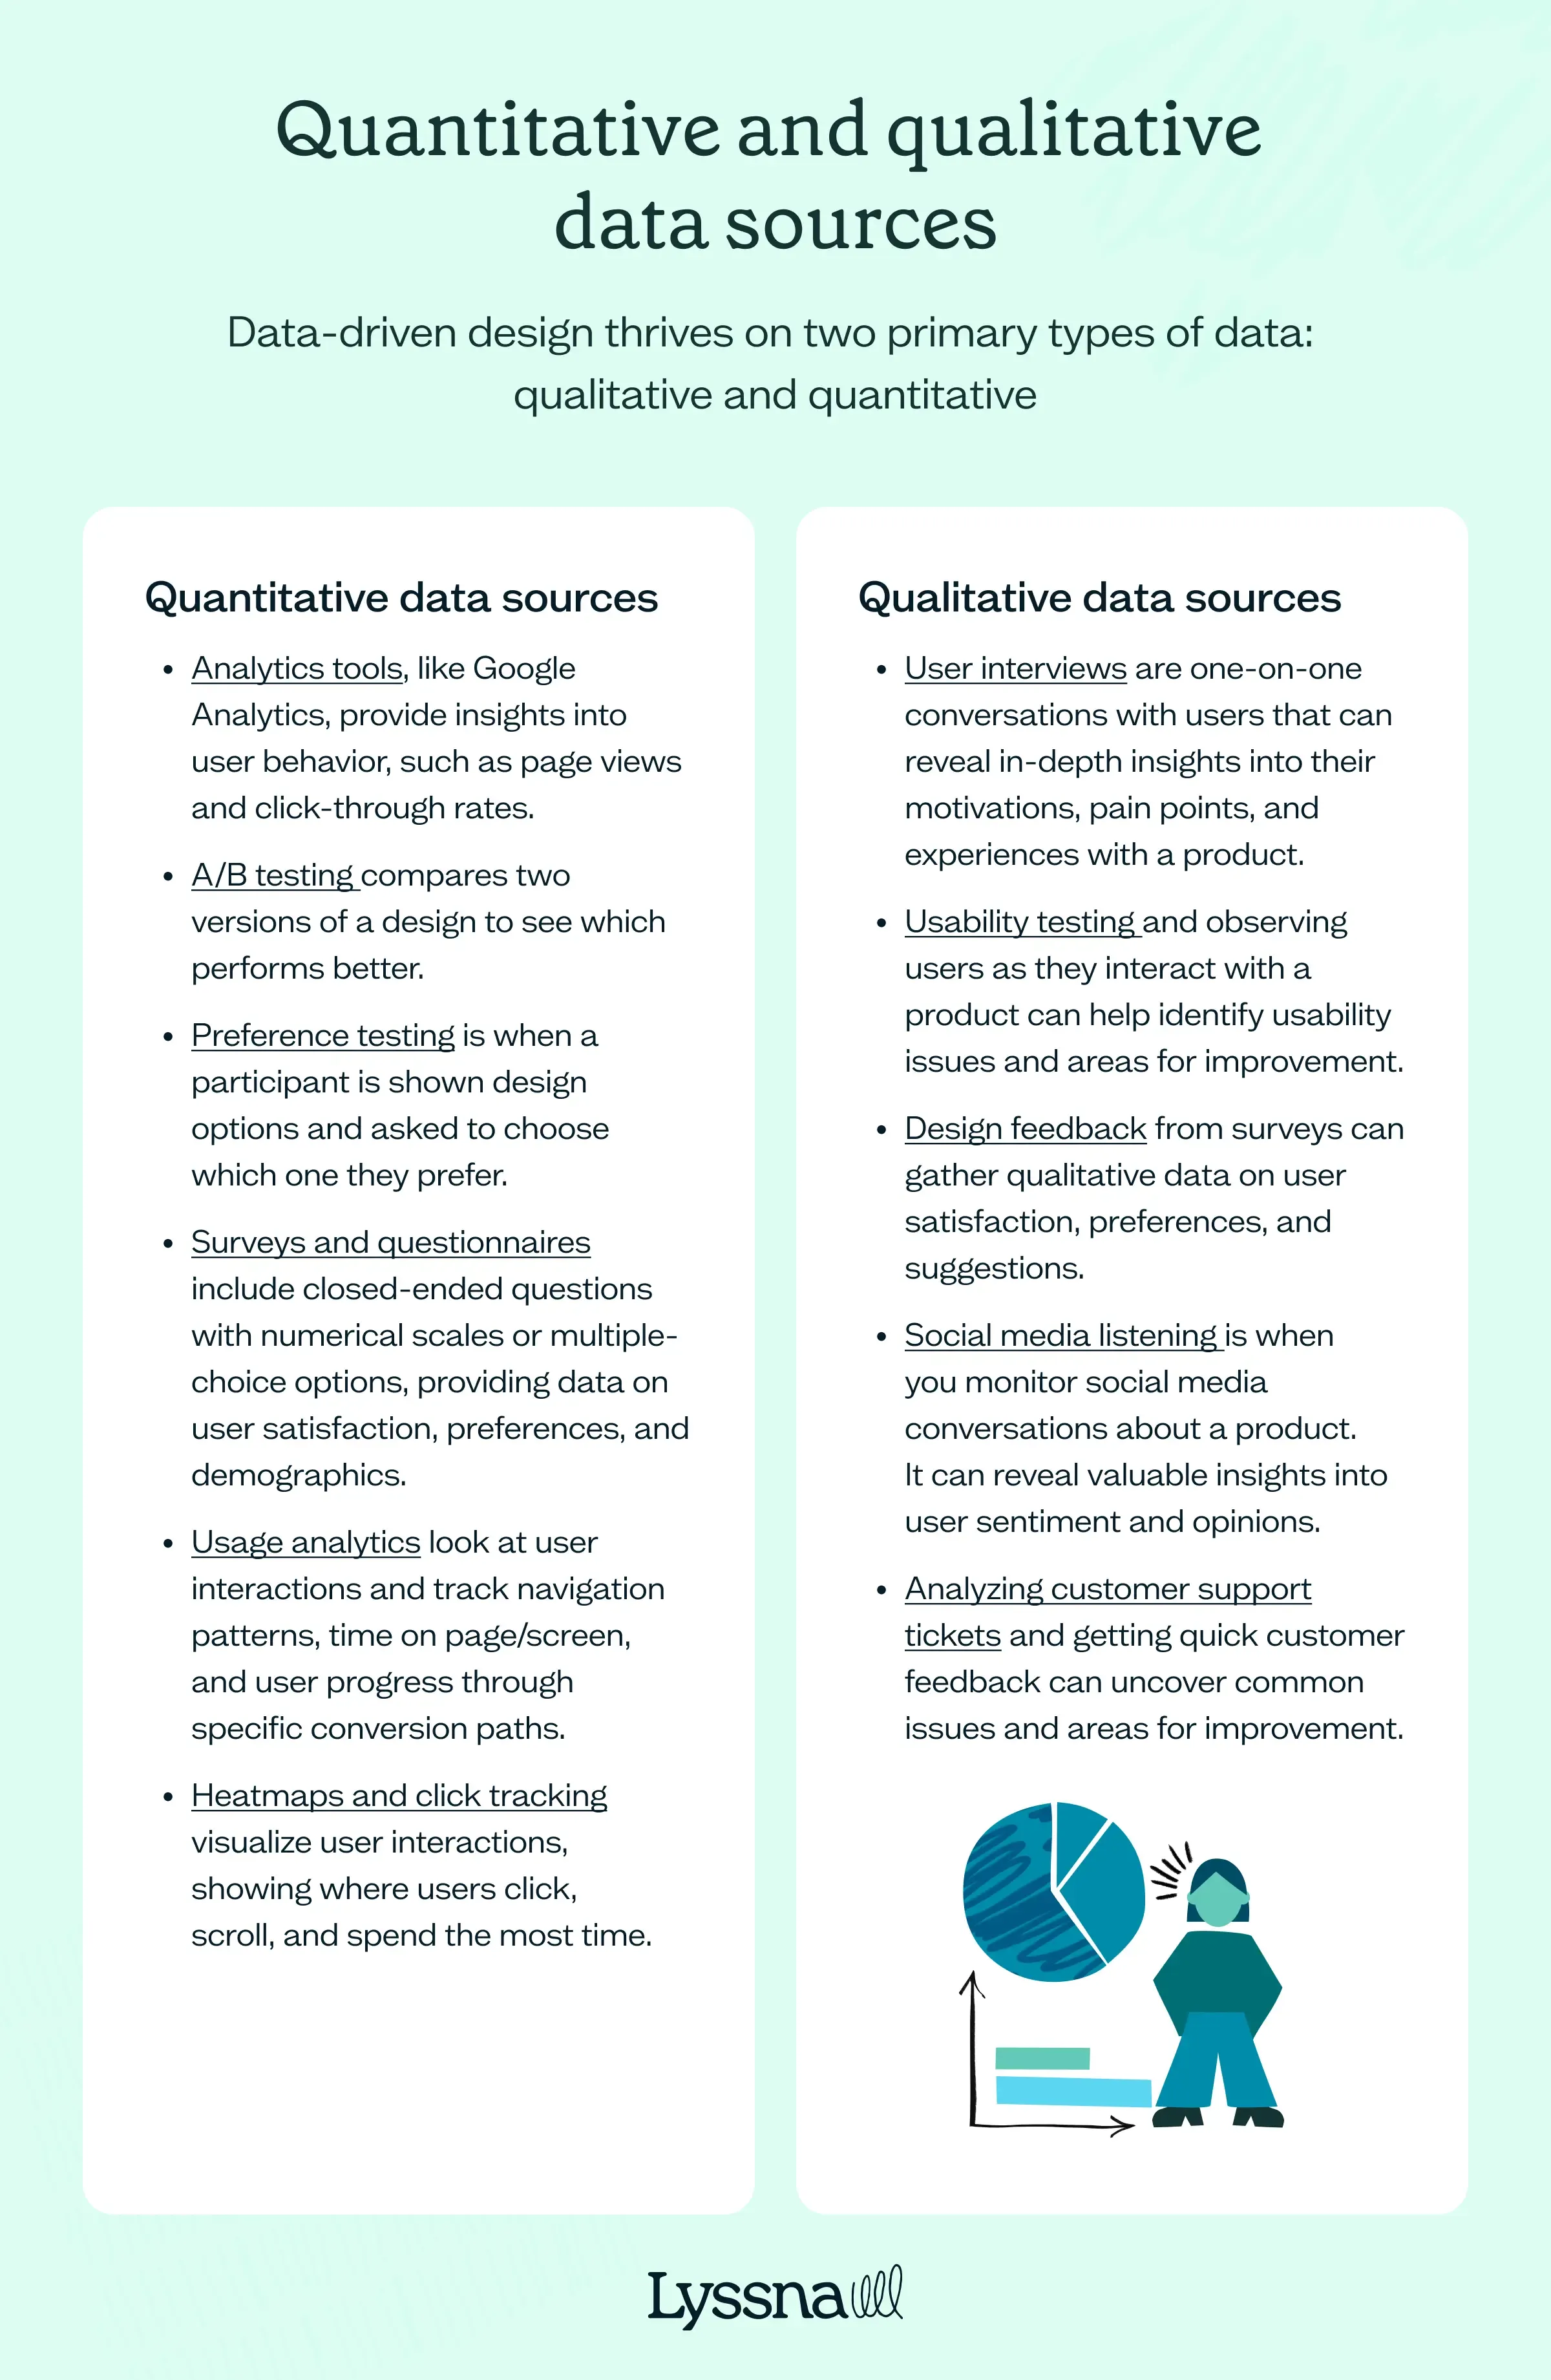
As we mentioned earlier, data-driven design thrives on two primary types of data: qualitative and quantitative. Think of them as the yin and yang of data.
Quantitative data
Quantitative data is the facts and figures that answer "how many" or "how much." It's all about measurements, statistics, and numbers. For example, web analytics can tell you how many users visit your website, how long they stay on each page, and what actions they take. These metrics offer valuable insights into user behavior patterns and trends.
Examples of quantitative data sources:
Analytics tools like Google Analytics, Adobe Analytics, and Mixpanel provide insights into user behavior on websites and apps, such as page views, click-through rates, bounce rates, and conversion rates.
A/B testing compares two versions of a design to see which performs better, and can help validate design decisions and optimize user experiences.
Preference testing is when a participant is shown design options and asked to choose which one they prefer.
Surveys and questionnaires include closed-ended questions with numerical scales or multiple-choice options. These can provide quantitative data on user satisfaction, preferences, and demographics.
Usage analytics analyze user interactions with your website or app. These can include tracking navigation patterns, time on page/screen, and tracking user progress through specific conversion paths (e.g. sign-up, checkout).
Heatmaps and click tracking visualize user interactions with a website or app, showing where users click, scroll, and spend the most time.
Qualitative data
Qualitative data aims to understand user motivations, opinions, and experiences through their own words and stories. User interviews, surveys with open-ended questions, and usability testing are all ways to gather qualitative data.
For instance, a user interview might reveal why a customer abandoned their shopping cart, or a usability test might uncover confusion in a checkout process. This type of data adds depth and context to the numbers, which provides a richer understanding of user needs and pain points.
Here are some examples of qualitative data sources:
User interviews are one-on-one conversations with users that can reveal in-depth insights into their motivations, pain points, and experiences with a product.
Usability testing and observing users as they interact with a product can help identify usability issues and areas for improvement.
Design feedback from surveys can gather qualitative data on user satisfaction, preferences, and suggestions.
Social media listening is when you monitor social media conversations about a product. It can reveal valuable insights into user sentiment and opinions.
Analyzing customer support tickets and getting quick customer feedback can uncover common issues and areas for improvement.
Recommended reading: Qualitative vs quantitative user research
Additional data sources may include:
Competitor analysis: Evaluate your rivals' strengths and weaknesses to identify best practices, differentiation opportunities, and areas for improvement.
Market research: Gather information about your target market's demographics, needs, and preferences to create products that truly resonate with them.
Recommended reading: Market research vs user research
Industry reports and benchmarks: Analyze industry trends, statistics, and performance metrics to understand the broader context in which your product exists and make informed strategic decisions.
How to analyze your data in data-driven design
Analyzing data in a data-driven design approach involves converting raw information into actionable insights to guide design decisions. Below is a breakdown of the key steps.
1. Clean and prepare data
To start, make sure your data is accurate, complete, and free from errors or inconsistencies. You may need to remove duplicates, fill in missing values, and standardize formats.
2. Identify key metrics and goals
Define the specific metrics you want to track (e.g. conversion rates, user satisfaction scores, task completion times) and align them with your design goals. This will help you focus your analysis and identify the most relevant insights.
3. Explore and visualize data
Use data visualization tools (e.g. charts, graphs, heatmaps) to uncover patterns, trends, and anomalies. This can help you quickly identify areas of interest, potential issues, and opportunities for improvement.
4. Segment your data
Divide your data into smaller groups based on specific criteria (e.g. demographics, user behavior, device type). This allows you to analyze specific user segments and tailor your design decisions to their unique needs and preferences.
5. Look for correlations and causations
Analyze relationships between different variables to understand how they influence each other. For example, does a specific design change lead to an increase in user engagement?
6. Validate hypotheses and test assumptions
Use your data to test your design hypotheses and assumptions. This can help confirm or disprove your ideas and make sure that your design decisions are based on evidence, not just intuition.
7. Iterate and refine
Based on your analysis, refine your design, test it again, and collect more data. This iterative process allows you to continuously improve your product based on real-world user feedback.
8. Communicate your findings
You’re now ready to share your findings with your team and stakeholders! Use clear, concise visuals and narratives in your report. If you’re looking for inspiration on how to structure it, check out this ux research report example for best practices on presenting your insights effectively. This ensures that everyone is aligned on the data-driven design decisions and their impact..
Tips and best practices when analyzing data
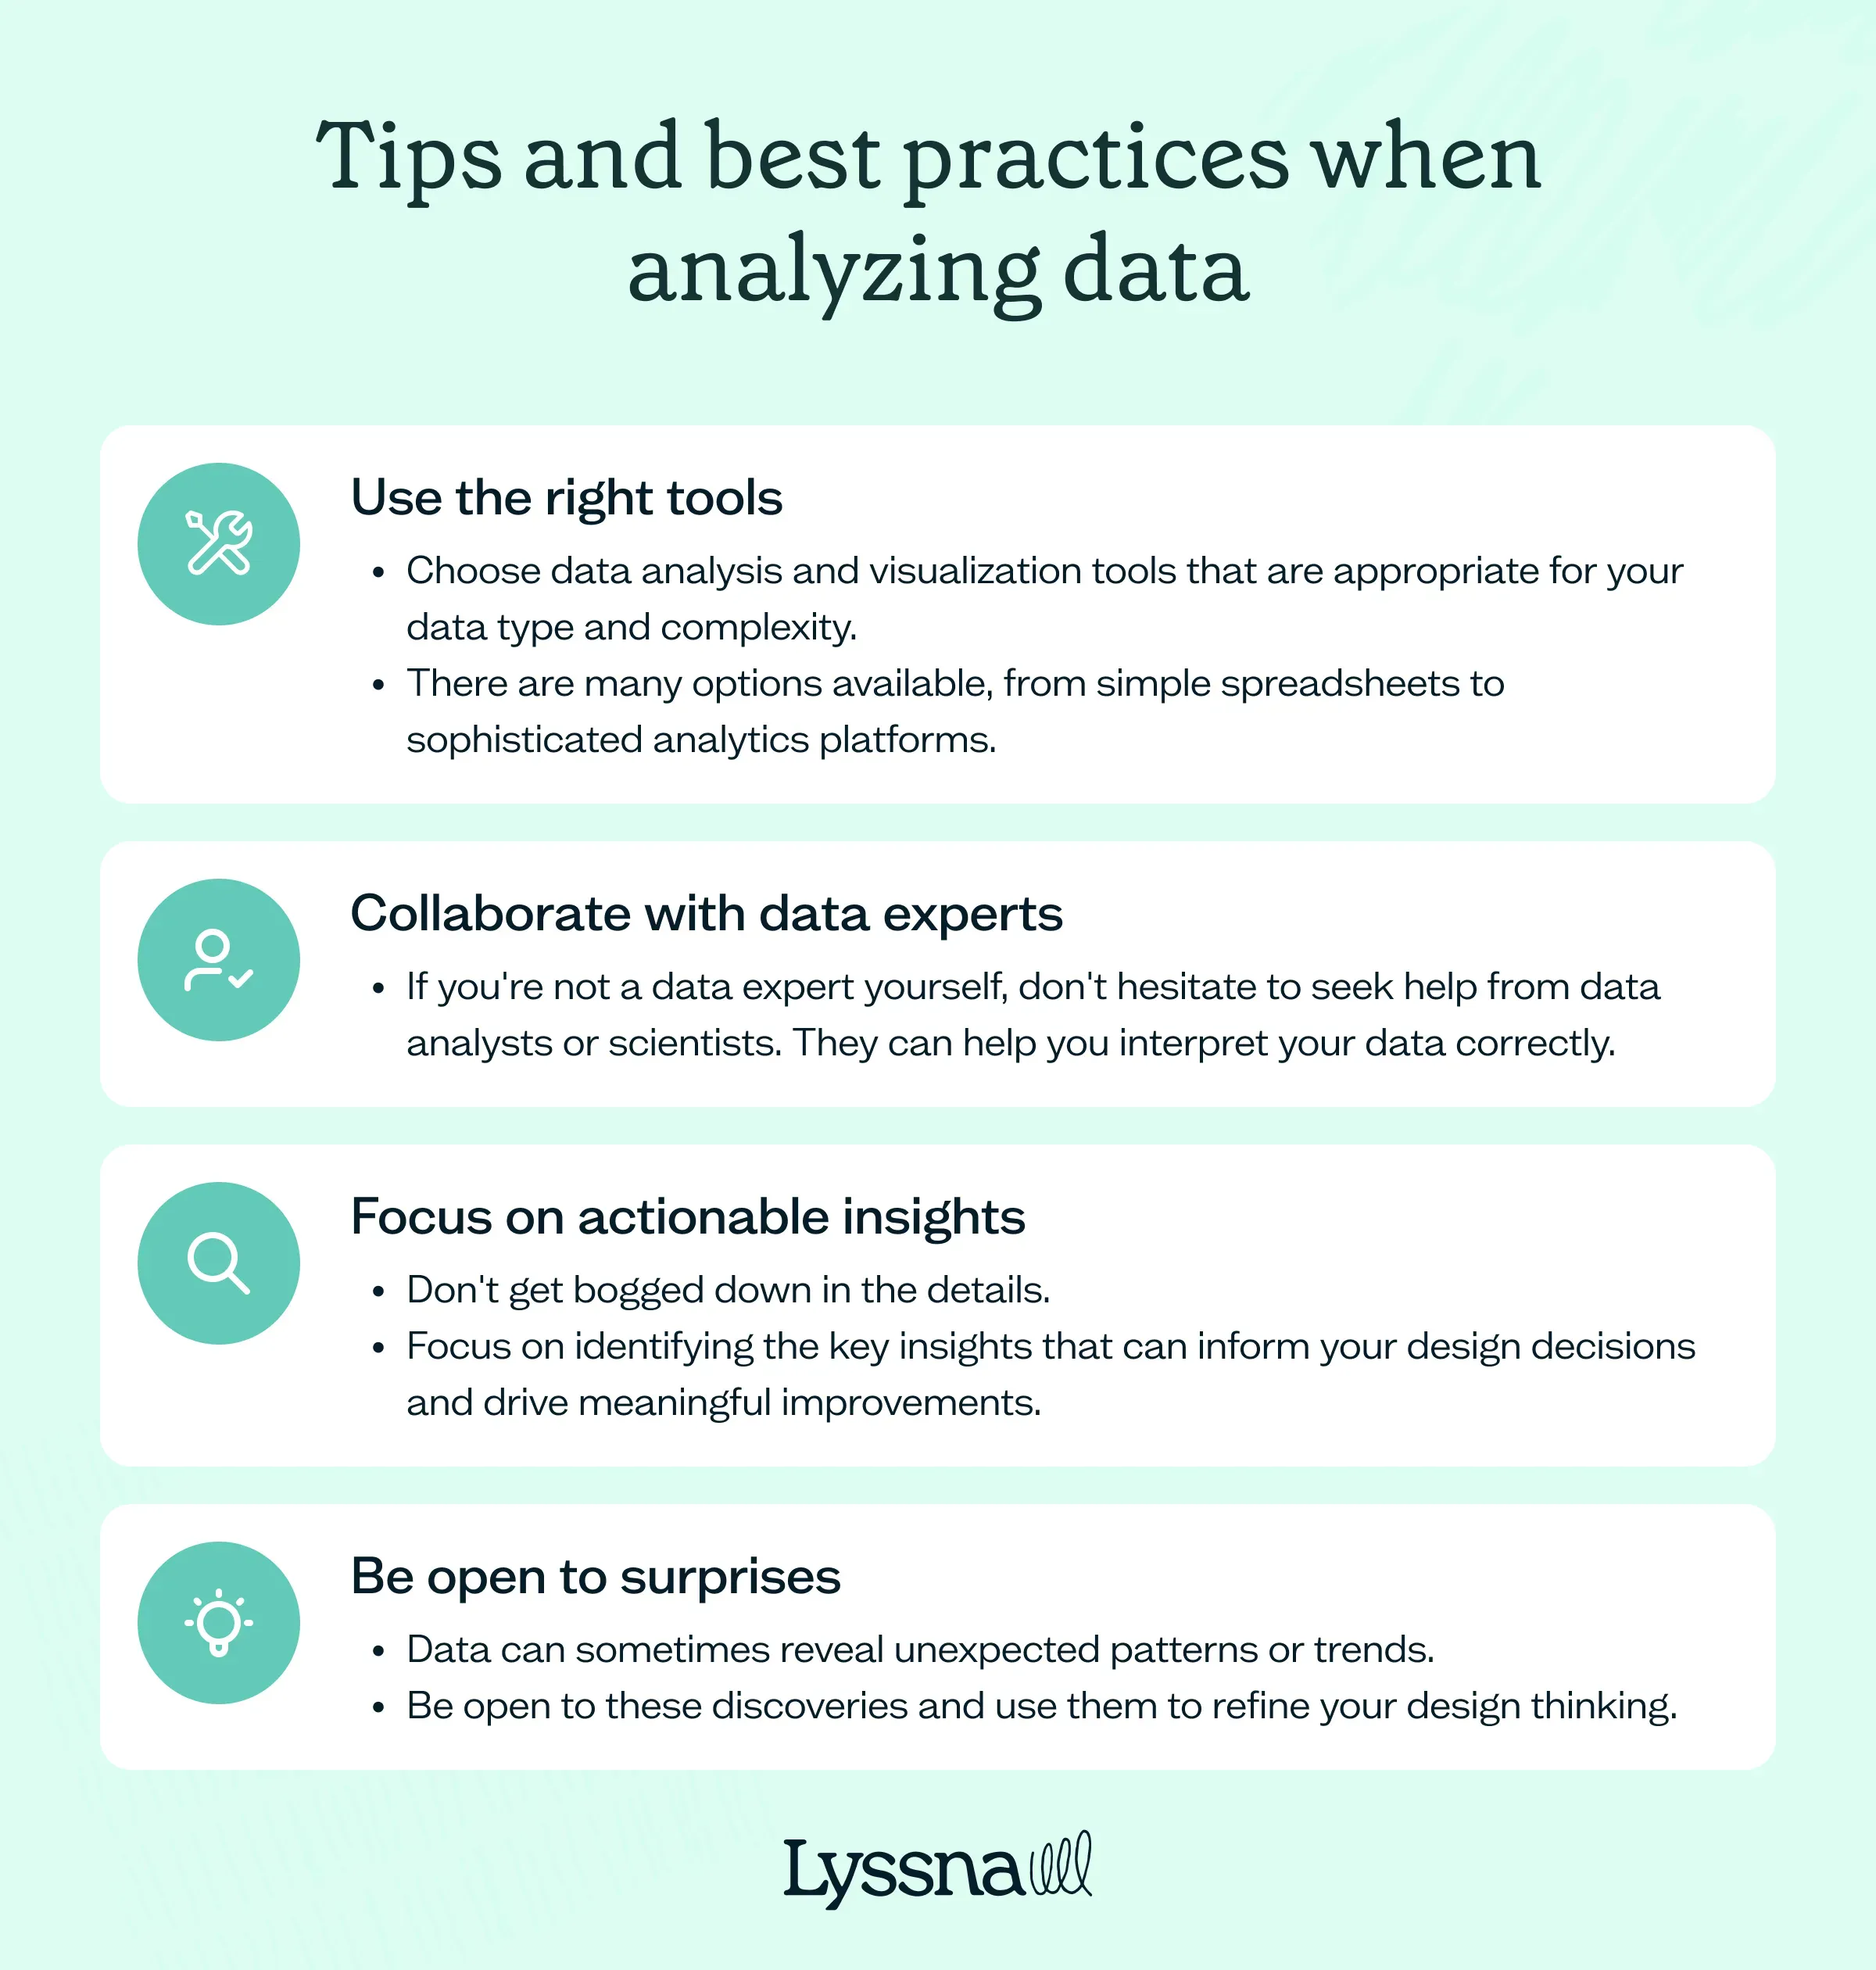
Use the right tools: Choose data analysis and visualization tools that are appropriate for your data type and complexity. There are many options available, from simple spreadsheets to sophisticated analytics platforms.
Collaborate with data experts: If you're not a data expert yourself, don't hesitate to seek help from data analysts or scientists. They can help you interpret your data correctly.
Focus on actionable insights: Don't get bogged down in the details. Focus on identifying the key insights that can inform your design decisions and drive meaningful improvements.
Be open to surprises: Data can sometimes reveal unexpected patterns or trends. Be open to these discoveries and use them to refine your design thinking.
How to present your findings in data-driven design
Transform your data-driven design findings into a compelling presentation with the following tips.
1. Know your audience
Like all types of presentations, tailor your design pitch to the specific needs and interests of your stakeholders. Are they executives focused on business goals, designers looking for actionable insights, or developers needing technical specifications? Adapt your language, level of detail, and focus accordingly.
2. Tell a story
Structure your presentation around a compelling narrative. Start with the problem or challenge you were addressing, explain your research process and methods, and then present your findings. It also helps you use storytelling techniques to capture attention, build empathy, and make your insights memorable.
3. Visualize your data
Choose the right visualization for each data point to highlight key trends, patterns, and relationships. Use charts, graphs, and infographics to make your data memorable and easy to understand.
Finally, avoid clutter and unnecessary complexity – keep it clear, concise, and visually appealing.
4. Highlight key insights
Don't just present raw data; focus on the most relevant and actionable insights. Clearly articulate the "so what?" for each finding – what does this data mean for the design, and what actions should be taken as a result?
5. Use real examples
Bring your data to life by showcasing real examples of user behavior, experiences, and feedback. Incorporate user quotes or testimonials to add a personal touch and demonstrate the impact of your findings on real people.
6. Be transparent and objective
Share your user research methodology and any limitations or biases that may have influenced your findings. This helps build trust and credibility with your audience. Additionally, be open to questions and challenges, and be prepared to defend your conclusions with evidence.
7. Focus on solutions, not just problems
While it's important to highlight pain points and areas for improvement, focus on the positive aspects of your findings as well. During this stage, you can present opportunities for innovation, new features, or enhancements that could improve the user experience.
8. Make it interactive
During your presentation, encourage discussion and feedback through polls, Q&A sessions, or brainstorming activities. Engaging your audience also helps them feel invested in the process and increases the likelihood of your recommendations being implemented.
9. Follow up
Finally, follow up with stakeholders after the presentation to make sure your recommendations are understood and acted upon. Offer your continued support and expertise as they implement changes.
How to be data-informed during the design process
Data-driven design isn't just about number crunching; it's a mindset shift. As Julie Zhuo emphasizes, the allure of "big data" often overshadows the complexities of its implementation. It's not enough to collect data; you need to interpret it, apply it strategically, and foster a culture that values it.
Zhuo also believes that being data-informed in product design comes down to the following set of values (she refers to it as the “Manifesto for the data-informed”).
1. Find purpose instead of searching for meaning in numbers
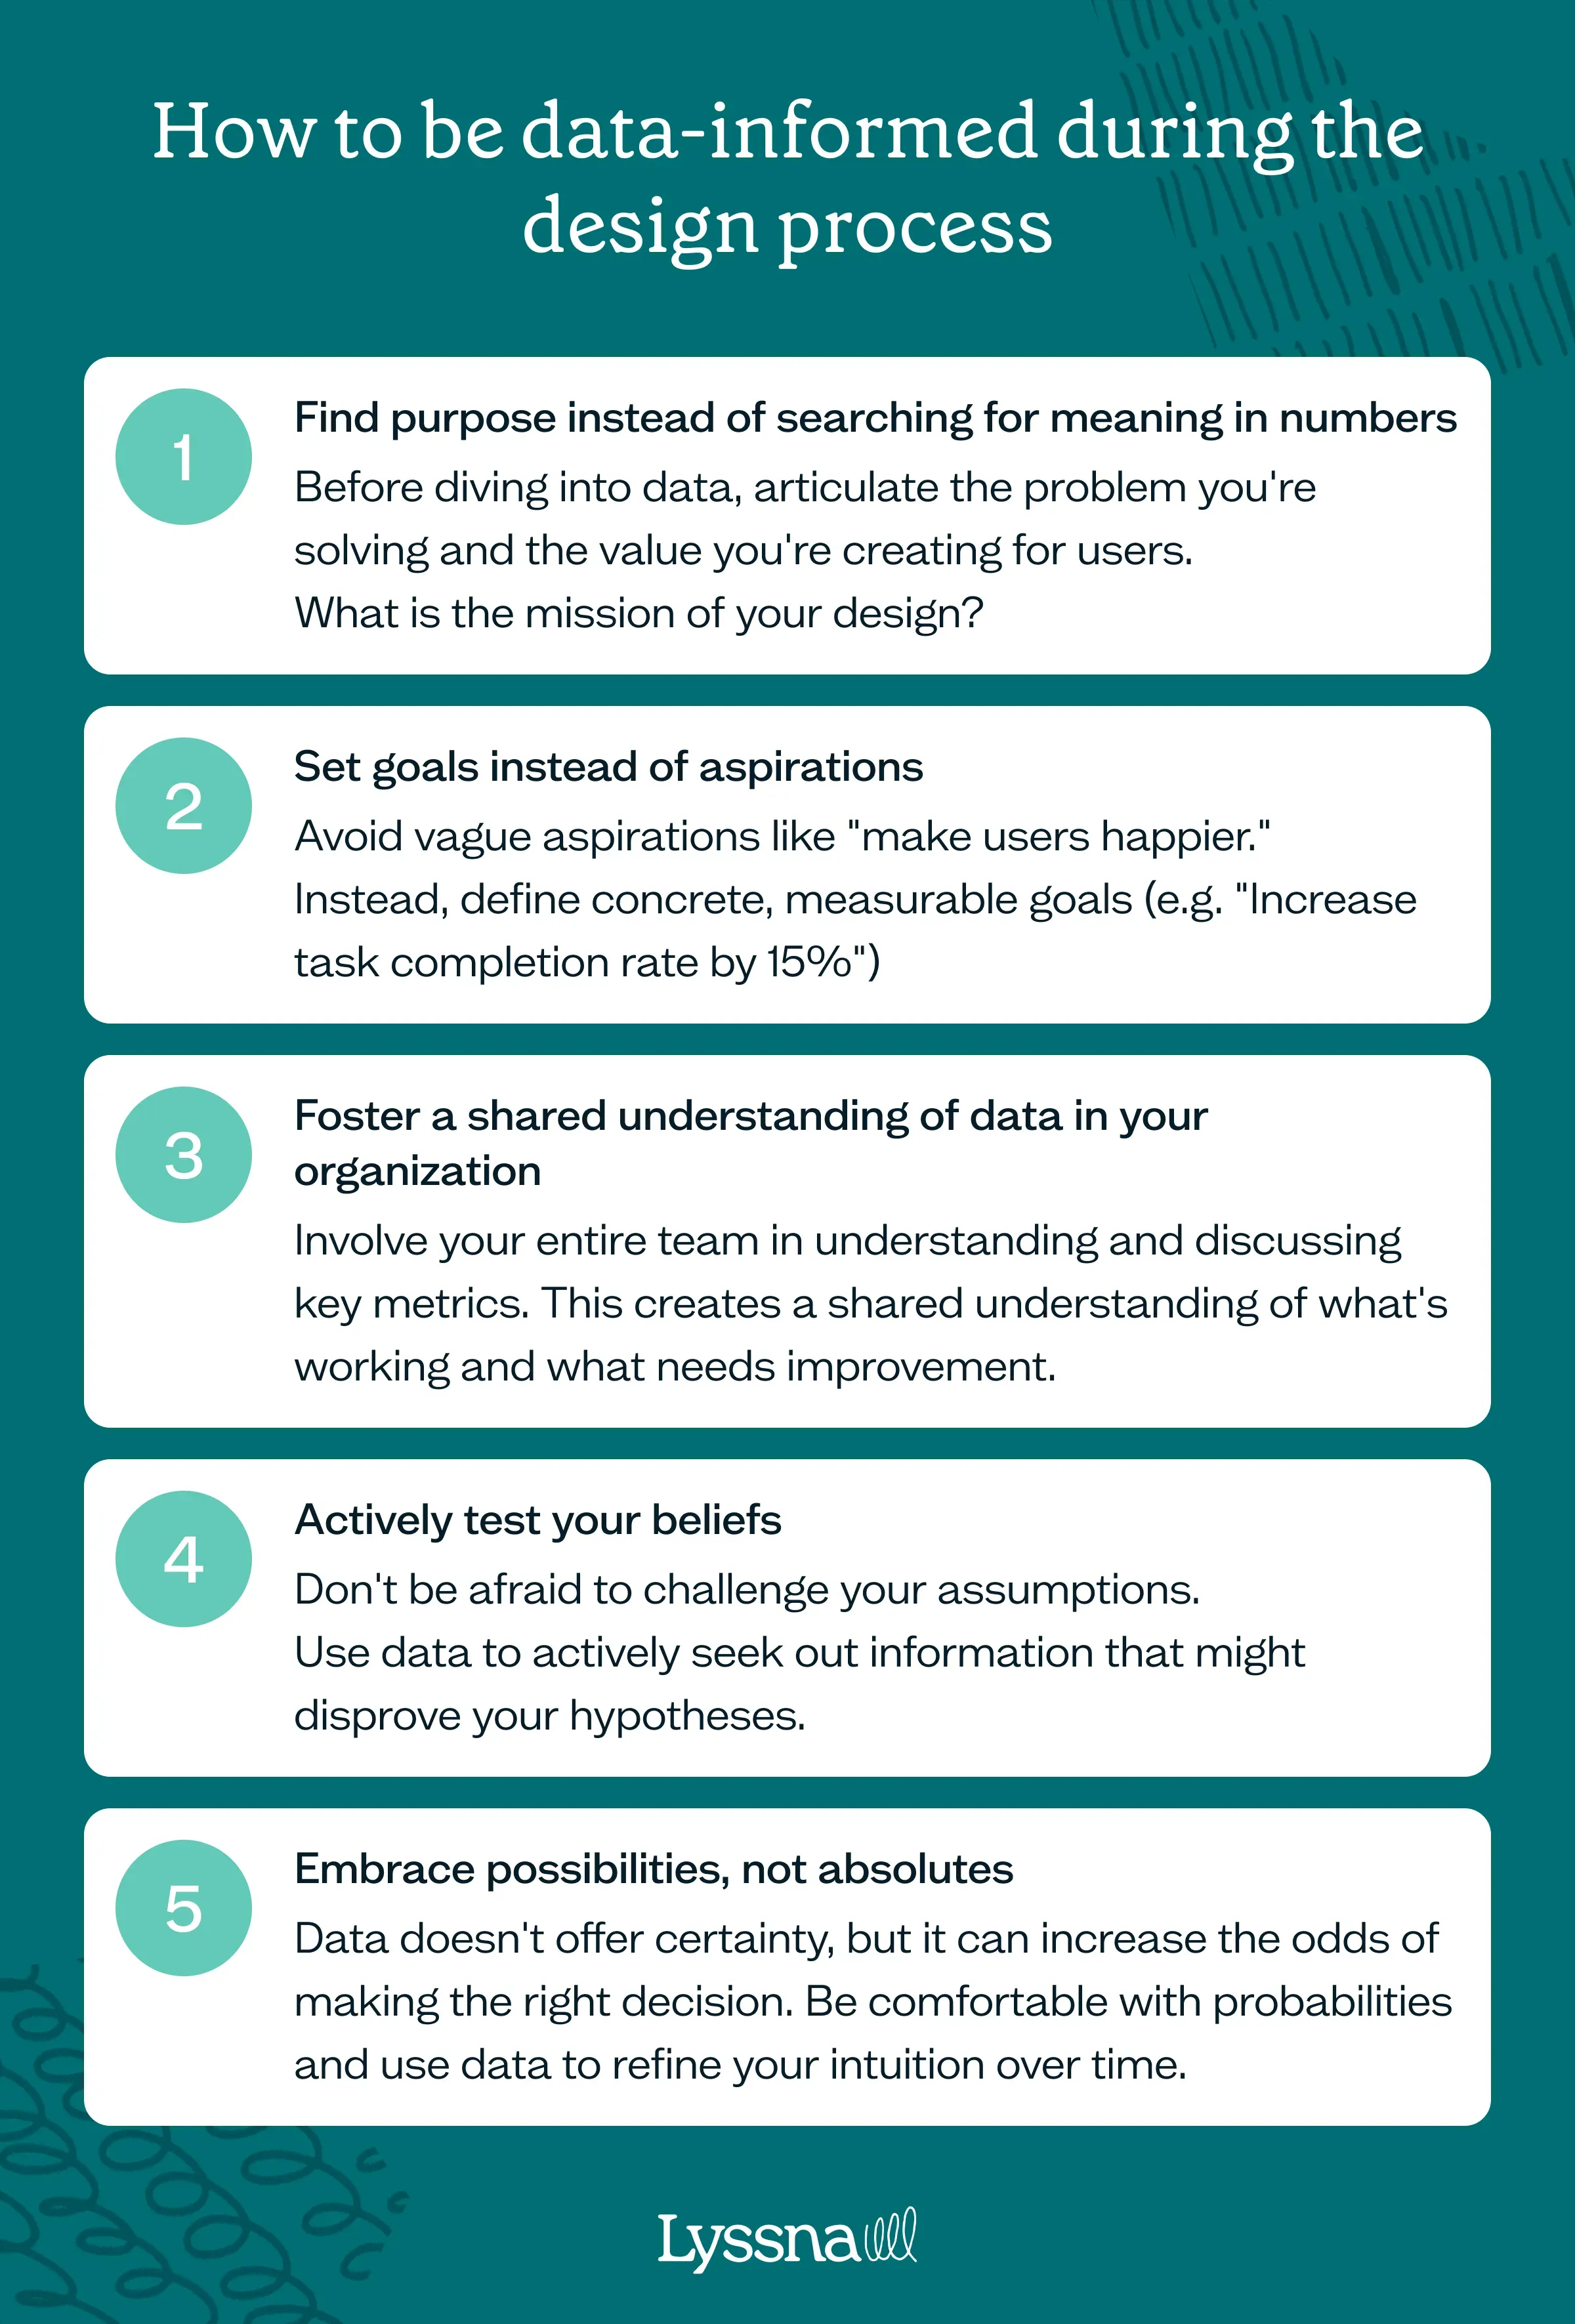
Before diving into data, articulate the problem you're solving and the value you're creating for users. What is the mission of your design?
Let your purpose guide your data collection. Don't just collect data for the sake of it.
"Metrics are merely proxies for what matters," says Zhuo. Make sure your metrics align with your core purpose.
2. Set goals instead of aspirations
Avoid vague aspirations like "make users happier." Instead, define concrete, measurable goals (e.g. "Increase task completion rate by 15%"). Then, track your progress toward these goals using data. This will help you evaluate the impact of your design decisions.
3. Foster a shared understanding of data in your organization
Don't leave data analysis to the "data people.” Involve your entire team in understanding and discussing key metrics. This creates a shared understanding of what's working and what needs improvement.
For example, you can hold regular meetings where you review key metrics, discuss insights, and brainstorm data-informed solutions together.
"Good data-informed teams develop leaders who can weave data into clear narratives. These teams cultivate a skilled understanding of which data patterns are important and which ones are not. They point out conflicts in data and which interpretation is more likely. Most importantly, they are upfront about what the data can and cannot say," writes Zhuo.
4. Actively test your beliefs
Don't be afraid to challenge your assumptions. Use data to actively seek out information that might disprove your hypotheses.
Zhuo advises: "Ask yourself: What evidence would convince you that your intuition is wrong? If the honest answer is No piece of data would convince me, then you have strayed off of the data-informed path."
5. Embrace possibilities, not absolutes
Data doesn't offer certainty, but it can increase the odds of making the right decision. Be comfortable with probabilities and use data to refine your intuition over time.
Whether you’re a UX researcher or product manager, keep in mind that data is a tool to help you make better-informed decisions, not a replacement for your creativity and expertise.
Your go-to user research platform
The best teams use Lyssna so they can deeply understand their audience and move in the right direction — faster.

Make data-driven design decisions with Lyssna
When you sign up for Lyssna's comprehensive suite of research tools, you can make data-informed design decisions based on real user feedback.
You can also share test results with key stakeholders, which helps foster a deeper understanding and alignment around findings. Plus, you can gather feedback fast while recruiting your ideal participants.
"It wasn't a big sell to move to a paid (Lyssna) account due to the speed at which you could put together a test, quickly get feedback, and recruit good participants. It just makes monetary sense. It's so cheap and the feedback is valuable," shares Alan Dennis, Product Design Manager at YNAB.
--
Kai has been creating content for healthcare, design, and SaaS brands for over a decade. She also manages content (like a digital librarian of sorts). Hiking in nature, lap swimming, books, tea, and cats are some of her favorite things. Check out her digital nook or connect with her on LinkedIn.
You may also like these articles


Try for free today
Join over 320,000+ marketers, designers, researchers, and product leaders who use Lyssna to make data-driven decisions.
No credit card required